


Population Divergence and Evolution of the Hawaiian Endemic Sesbania tomentosa
(Fabaceae)
Sesbania tomentosa (Fabaceae) is an endemic flowering plant primarily adapted to coastal strand and dry lowland habitat in the Hawaiian Islands. Previous studies have attempted to delineate distinct taxa from among the extant populations. In the most recent treatment of Hawaiian Fabaceae, however, S. tomentosa was recognized as a single polymorphic species with two forms. To re-address issues of taxonomy, the present study utilized microsatellite marker variation and DNA sequencing to discriminate Hawaiian Sesbania populations. While there was no DNA sequence variation among species for ITS or TRPT gene regions, microsatellite analysis found a highly differentiated population structure at the nine loci sampled. Bayesian genetic clustering assignments and associated private alleles occurred in a distinct phylogeographic pattern. As a result, three distinct genetic groups were identified corresponding to islands of origin: populations from Nihoa, Kaua‘i, and O‘ahu (group 1), populations from Maui, Kaho‘olawe, and Moloka‘i (group 2), and populations from Hawai‘i Island (group 3). The extremely varied yet randomly overlapping morphologies among the populations suggest widespread convergent evolution has occurred and precludes any subspecific taxonomic designations. We interpret the high levels of genetic marker and morphologic differentiation exhibited by Hawaiian Sesbania to be a product of the plant’s reproductive ecology and its influence in sub-structuring populations on a small geographic scale. Efforts toward preservation of the wide range of distinctive appearing morphotypes should continue, facilitated by the natural tendency of the plant to maintain a more or less fixed state of certain traits within populations.
biogeography, evolution, Fabaceae, Hawai‘i, population genetics, Sesbania
The boundaries of species that have recently and rapidly diverged are difficult to determine when species-specific traits have not had sufficient time to coalesce (Glor 2010 ). Even if the morphology of the species in question seems to suggest such boundaries, DNA sequence divergence often will not have occurred due to insufficient time for accumulation of mutations within the different types (Mort et al. 2007). Hawaiian plant radiations are well recognized for dramatic morphological variation disconnected from any genetically detectable sequence differences (e.g., Gemmill et al. 2002, Lindqvist et al. 2003, Knope et al. 2012, Cantley et al. 2014). On the other hand, population genetic markers tied to allele frequencies diverging at a much more rapid pace are able to distinguish genetically isolated groups of populations, making them a suitable choice for analyzing [End Page 447] recent and rapid plant radiations ( Zhang and Hewitt 2003).
An investigation into the evolution of the Hawaiian endemic Sesbania tomentosa Hook. & Arn. (Fabaceae) is warranted, as past taxonomic history suggests there are relationships to resolve within this highly variable species. In the most recent treatment of Hawaiian Fabaceae, however, S. tomentosa was recognized as a single species with two forms (f. tomentosa and f. arborea Rock; Geesink et al. 1990). A subsequent genetic study by Gemmill et al. (1995) demonstrated that two major groups of Hawaiian Sesbania emerged when measuring variation at ten isozyme loci across the geographical range of the species. One group comprised populations from the islands of Nihoa, Kaua‘i, and O‘ahu and the other Moloka‘i, Maui and Hawai‘i Island. An analysis of S. tomentosa with DNA sequences and population genetic markers would aid in confirming taxonomic relationships, if any exist.
Understanding both the nature of population differentiation and its extent (in terms of putative speciation) has important implications for restoration management of this federally listed endangered species. For example, three extremely distinct morphological ecotypes have been found along a 25 km section of the west coast of Kaua‘i (a tree to 3 m with drooping branches and glabrous leaflets growing on the margins of brackish ponds, an erect shrub 1–2 m with pubescent leaflets growing on sand dunes and prostrate plants with silvery-green leaflets growing on rocky substrate). One hundred years ago, three distinct morphotypes were observed within 10 km of one another on the island of Moloka‘i (completely prostrate plants with dense hairs on both upper and lower leaflet surfaces, erect plants with minor pubescence on leaflets, and tall trees with glabrous leaflets) (Hawai‘i Biodiversity and Mapping Project). Restoration managers need to address the genetic structuring of this species before considering the translocation of pro-pagules to enhance genetic variation within reproductive populations. This is important, as mixing populations representing distinct morphologies (or potentially separate taxa) may risk the loss or alteration of unique characters.
Sesbania tomentosa is adapted to coastal strand and dry to mesic upland habitat. The habit of Sesbania tomentosa is highly variable, often with island specific forms (Figure 1). Plants may grow as sprawling shrubs with prostrate to decumbent branches (in certain locations up to 14 m long, and possibly longer) or as a small bush or tree up to 6 m in height. Leaves are even-pinnately compound and consist of 18–38 oblong to elliptic leaflets, each 15–38 mm long and 5–18 mm wide. The species is named for the leaves, which are usually sparsely to densely covered with silky silver-green hairs. The flowers, in clusters of 2–9, are salmon colored tinged with yellow, orange-red, scarlet, or deep red. Fruits are slightly flattened pods 7–23 cm long and about 5 mm wide, and contain 6–27 olive to pale or dark brown seeds. The chromosome number reported is 2n = 24 (Geesink et al. 1990) suggesting the species is diploid (base chromosome number x = 12).
G. T. Lay and A. Collie were the first to collect Sesbania tomentosa during the voyage of the H. M. S. Blossom through the Hawaiian Islands (1826–1827), and their specimen was later described by Hooker and Arnott (1838). Gray (1854) described S. tomentosa as a woody plant with decumbent (semi-prostrate) stems, having branches and foliage silky-tomentose when young, but turning glabrate with age. He noted that these plants occurred on the Wai‘anae coast of O‘ahu and on the coast of Hawai‘i east of Kīlauea Crater (Gray 1854). Hillebrand (1888) described S. tomentosa in much the same way as Gray (1854) , only he found it occurring as a multi-branched shrub, 6–12 feet (1.8–3.6 m) in height. His specimens were also collected from the Wai‘anae coast of O‘ahu and on the southern shores of Moloka‘i, Lāna‘i, and Hawai‘i.
Rock (1920) proposed the alternate form Sesbania tomentosa f. arborea Rock, an arborescent type he had collected at Mahana (west Moloka‘i) growing 12–15 feet (3.6–4.5 m) in height. He described the leaves as being longer, and the leaflets smaller and more numerous than the creeping variety he found growing in the nearby Mo‘omomi dunes. [End Page 448] Rock lists this arborescent form as also being present on the islands of Kaua‘i, O‘ahu, and Hawai‘i.

Examples of several Sesbania tomentosa morphotypes examined in this study, identified by geographical population: (A) trailing lower branches in ash dunes at Pepeiau, Hawai‘i; (B) slender erect stems at Kū‘ē‘ē, Hawai‘i; (C) long pale green-grey leaflets and orange flowers at Waiaka‘īlio, Hawai‘i (M. Euaparadorn); (D) deep red flowers at Pu‘u Koa‘e, Kaho‘olawe (K. Wood); (E, F) Hylaeus bee exiting flower and dissected flower showing stigma and stamens from Kīpuka Nēnē (M. Euaparadorn); (G) small arborescent at Pu‘u Pīmoe, Maui; (H ) large arborescent at Kawela, Moloka‘i; (I) silky leaves and procumbent growth at Mo‘omomi, Moloka‘i; (J) pale red flowers and glabrous leaves at Mānā, Kaua‘i (D. Burney); and (K) erect shrub at Polihale, Kaua‘i (N. Tangalin). Photographs by D. Cole unless otherwise noted.
Degener (1938) was the first to consider that S. tomentosa represents a poorly understood species complex that is probably composed of a number of forms (delineated primarily in terms of plant habit and leaf pubescence) on most of the islands. Degener and Sherff (1949) considered the prostrate form at Mo‘omomi, Moloka‘i to be sufficiently distinct to warrant its own variety (S. tomentosa var. molokaiensis Degener & Sherff), due in part to the dense sericeous tomentum found on both surfaces of the leaflets. Degener and Degener (1978) recognized four new species of Hawaiian Sesbania elevating S. tomentosa var. molokaiensis and f. arborea to S. molokaiensis (Degener & Sherff) Degener & I. Degener and S. arborea (Rock) Degener & I. Degener, respectively. They also described S. hawaiiensis Degener & I. Degener from the South point region of Hawai‘i (mainly on the basis of slight variations in flower, stem and seed color) and S. hobdyi Degener & I. Degener, a small erect tree from the island of Lāna‘i with long extending branches and only a minor pubescence on the lower surface of leaflets. Currently there are no known extant populations on Lāna‘i, the only Hawaiian Island believed to have completely lost this species from its flora.
Char’s (1983) taxonomic thesis is the most recent and extensive survey of the morphological variation among Hawaiian Sesbania populations, making the observation that the presence or absence of hairs on either the upper, lower, or both leaflet surfaces is a useful taxonomic character. She recognized seven species including Sesbania tomentosa (with two [End Page 449] varieties), S. molokaiensis, and S. arborea ; four putative taxa were newly named and described although none were ever validly published. Her research reported that while a certain degree of phenotypic plasticity is apparent in varieties of Hawaiian Sesbania, cultivated individuals in a common garden retained the same morphological characters as their counterparts in the field (Char 1983) suggesting differences were genetically based.
The purpose of the present study was to assess all extant populations of Hawaiian Sesbania for their DNA sequence and microsatellite marker variation. Phylogenetic inference at the molecular level used sequences from two nuclear DNA regions: the non-coding internal transcribed spacer (ITS) of the ribosomal DNA cistron (Baldwin 1993) and the highly variable gene-coding region triosephosphate translocator (TRPT) (Choi et al. 2006 ). No chloroplast gene regions were examined as a previous study across Sesbania taxa worldwide (Farruggia 2009) showed little variation with these markers and no variation was found among four Hawaiian populations (unpublished data). Microsatellite markers were used to assess within and among population variation found in individuals and to assess the degree of population differentiation. Microsatellite variation will provide an estimate of genetic relationships among the populations and taxa previously identified by others.
materials and methods
DNA Sampling
Leaf samples of 486 individuals of Sesbania tomentosa were collected between 2006 and 2009 representing 16 populations from seven islands of naturally occurring populations throughout the Hawaiian Islands (Table 1). An approximately 4 cm2 square leaflet tip from each plant was collected for DNA analysis. Except where noted, all known individuals extant at the time of collection and only naturally occurring plants (i.e., not outplanted individuals) were sampled for analysis. Samples at ‘Āpua point, Kawela–Kamiloloa, Pu‘u Koa‘e, and Nihoa comprise a subset of their respective populations (individuals sampled from throughout each populations range). An attempt to distinguish groups of naturally occurring vs. out-planted individuals at Ka‘ena point was made with the assistance of Hawai‘i Division of Forestry and Wildlife personnel. Leaf tissue was dried with silica gel desiccant in an airtight container, and then transferred into cold storage (4–8 °C) prior to DNA extraction. All extractions were carried out using 0.5–1.0 g of leaf material with DNeasy tissue kits (Qiagen; Valencia, CA) according to the manufacturer’s specifications. The purified sample, along with negative and positive controls, were visually checked using electrophoresis.
Additional sampling of historically collected tissue from the Mo‘omomi dunes population on Moloka‘i was conducted with loaned specimens from the herbarium of the New York Botanical Garden (NY), the B.P. Bishop Museum Herbarium (BISH), and the U.S. National Herbarium (US) (Table 1). DNA was extracted from 10 specimens using Qiagen’s QiaAmp Stool minikits, modified CTAB protocols (Drábková et al. 2002), and a PTB (N-phenacylthiazolium bromide) protocol (Asif and Cannon 2005 ). For each of the 10 specimens, at least one of the extraction protocols listed proved successful. These historically collected samples were included in the analysis of microsatellite fragment sizes to supplement the allelic diversity of the 2006 collection of extant plants at Mo‘omomi.
The scant demographics of certain populations necessitated augmentation of the dataset in order to provide marginally larger sample sizes for comparison. DNA from a herbarium specimen (Neal, 55933, BISH) collected in 1934 from the Mōkapu peninsula (O‘ahu) was extracted, which supplemented a DNA sample collected in 2008 from Mōkapu at Nu‘upia Ponds. Another herbarium specimen (Fosberg, 14052, US) collected in 1937 from the islet of Kāohikaipu (O‘ahu) was extracted to supplement total extant diversity represented by two Kāohikaipu-derived individuals in cultivation at the Hawai‘i State nursery (Mokulē‘ia, O‘ahu). These five samples were combined into a single Windward O‘ahu “population” for this analysis. Genotypes of [End Page 450]

Origin of DNA Samples Analyzed of Sesbania tomentosa and Related Species
[End Page 451]
cultivated individuals distinct from those collected from natural populations for this study were also used to augment the Kīpuka Nēnē–Hilina pali, Hawai‘i Island (10 individuals), Pu‘u Pīmoe, Maui (three individuals), and Papanalahoa, Maui (three individuals) populations. The genotypes were assumed to have been derived from parent plants that were not present in the populations at the time tissue collections were made. All five individuals comprising the Mānā, Kaua‘i population are cultivated specimens of the National Tropical Botanical Garden (F1 and F2 generation derived from a single wild plant, now extirpated). The Polihale, Kaua‘i population is composed of groups of unique genotypes collected over three sampling years (2006–2010), in addition to eight distinct cultivated genotypes. For the Waiaka‘īlio, Hawai‘i Island population, only a single surviving individual was extant at the time sampling was undertaken, and DNA was successfully extracted from eight plants with the PTB protocol of Asif and Cannon (2005) using the woody core from plants that had been standing dead for approximately one year. In addition, the seedbank surrounding the standing dead plants was examined, producing an additional 10 plants for genotyping (Table 1).
Outgroup species for phylogenetic analysis were selected based on close affiliation to Hawaiian Sesbania. Fosberg (1948) and Sachet (1987) considered the Marquesan species S. marchionica F Br. (referred to as S. coccinea (L.f.) Poir) to have a close relationship to the Hawaiian Sesbania. Four additional taxa were selected based on the phylogenetic analysis of Farruggia et al. (2018) : S. herbacea (Mill.) McVaugh, S. vesicaria (Jacq.) Elliott, S. formosa (F. Muell) N.T. Burb., and S. grandiflora (L.) Pers.
PCR, Sequence and Microsatellite Analysis
Twenty-three samples (22 of Sesbania tomentosa plus 1 S. marchionica; Table 1) were chosen to be amplified and sequenced at the two nuclear regions using primers described in the literature (ITS: White et al. 1990, TRPT: Choi et al. 2006). These 22 samples of S. tomentosa represent the separate species and varieties delimited in the taxonomic thesis of Char (1983). Each sample was amplified in a 25.0 μL volume with final concentrations of 0.5 μM each of forward and reverse primers, 1 × PCR buffer, 2.0 mM MgCl2, 0.8 mM dNTPs (Promega Corporation, Madison, Wisconsin, USA), 1 unit Taq polymerase (Promega), and 20–30 ng of DNA sample. Amplification took place using an MJ Research Thermocycler (Waltham, Massachusetts, USA) with the following conditions: initial denaturation at 95 °C for 2 min, 35 cycles of 95 °C for 30 s, 55 °C for 1 min, and 72 °C for 1 min, ending with a final extension of 72 °C for 7 min. PCR products were electrophoresed on 1% agarose to verify amplified product, cleaned with ExoSAP (USB Corp., Cleveland, Ohio, USA) following manufacturer specifications and then bi-directionally sequenced at the Advanced Studies in Genomics, Proteomics and Bioinformatics Center (ASGPB; University of Hawai‘i at Mānoa).
Sequences for each of the two regions were edited (Chromas Lite v. 2.11, Technelysium Pty Ltd., 2012) and aligned with GenBank sequences from four additional cosmopolitan Sesbania species (Table 1) using Mega v. 6.0 (Tamura et al. 2007). Bayesian analysis was carried out using the GTR model in MrBayes v. 3.1 using 10 million MCMC replications following a burn-in of 2 million replicates. Posterior probabilities were calculated by MrBayes to provide statistical support at the nodes. A sequence obtained from a North American sample of S. herbacea was used as the sole outgroup in this analysis, as Farruggia et al. (2018) placed it with Hawaiian Sesbania in a well-supported clade. Both phylogenetic trees were visualized using Fig Tree v. 1.3.1.
Genetic Identification Services (Chatsworth, CA, USA) constructed libraries and isolated potential microsatellite primer loci for Sesbania tomentosa. Ninety-six dinucleotide (CA n) and tetranucleotide (CATCn, TACA n , and TAGAn) microsatellite-containing clones were identified after sequencing, for which 54 sets of primers were developed using DesignerPCR v. 1.03 (Research Genetics, Huntsville, Alabama, USA). Nine microsatellite loci were subsequently chosen (Table 2) [End Page 452]

Nine Microsatellite Primer Pairs Developed for Sesbania tomentosa
based on their range of polymorphism, size of amplified products, and ease of scoring in a screening of eight DNA samples from distinct geographic populations. Each sample was amplified in a 25.0 μL volume with final concentrations of 0.6 μM each of forward and reverse primers, 1 × PCR Buffer, 2.0 mM MgCl2, 0.8 mM dNTPs (Promega Corporation, Madison, Wisconsin, USA), 1 unit Taq polymerase (Promega), and 2–4 ng DNA in a 96-well amplification plate. Amplification took place using an MJ Research Thermocycler with the following conditions: initial denaturation at 94 °C for 3 min, 30 cycles of 94 °C for 40 s, primer-specific annealing temperature (Table 2) for 40 s, and 72 °C for 30 s, with a final extension of 72 °C for 4 min. PCR products were electrophoresed on 1% agarose to verify amplification. One negative and four positive controls (samples with known genotypes) were included in each PCR reaction to check for potential contamination and standardize genotyping.
For each of three fluorescently-labeled primer pair multiplex combinations, 1.0 mL of pooled PCR product was visualized on the ABI Prism 377XL sequencer at the ASGPB (University of Hawai‘i at Mānoa). The complete dataset of allele sizes was constructed using ABI Peak Scanner and Genemarker v. 1.4 (Softgenetics; State College, PA, USA) software, and through visual inspection of the PCR peak sizes generated in comparison with LIZ500 molecular size marker (ABI). Stutter peaks were identified, and then the program Micro-Checker (Van Oosterhout et al. 2004) was used to identify possible genotyping errors due to non-amplified (null) alleles and short allele dominance (large allele dropout). A maximum likelihood estimate of the frequency of null alleles (Dempster et al. 1977) was then calculated for each locus and geographic population using the program FreeNa (Chapuis and Estoup 2007). The microsatellite dataset was analyzed to assess linkage (genotypic) disequilibrium in Genepop v. 4.0 (updated from Raymond and Rousset 1995) using log-likelihood ratio statistics (G -tests).
Data Analysis
Population structure was examined using a full Bayesian-clustering approach, implemented [End Page 453] in the program STRUCTURE v. 2.3.3 (Pritchard et al. 2000), which assigned individual genotypes to populations, irrespective of geographical location of origin. Default settings of the program were used (admixture model, independence among loci). To determine the most likely number of populations or groups (K) in the data, a series of analyses were performed from K = 1 (all populations represent a single panmictic unit) to 15 (the maximum number of populations allowable) using 40,000 burn-in generation and 100,000 repetitions, with ten iterations per K. These results were examined using the ΔK method (Evanno et al. 2005) to identify the most likely number of groups in the data. Ten additional iterations at the identified K were computed using 100,000 burn-in generation and 300,000 repetitions. The program Clumpp v. 1.1.2 (Jakobsson and Rosenberg 2007) was used to summarize these last ten iterations. Cluster membership coefficients for each individual were obtained (permuted across replicates using FullSearch algorithm) and used as input files for the cluster visualization program Distruct v. 1.1 (Rosenberg 2004 ). Substructure within each K was examined similarly, although in this case both the Full-Search and Greedy (10,000 random input orders of runs) algorithms were used in Clumpp. Each individual was assigned to a particular genetic cluster when its coefficient of membership was greater than 50%. Geographic populations were assigned to a particular genetic cluster when 72–100% of their individuals were assigned to that genetic cluster. Geographic populations assigned to sub-clusters was based on 58–100% individual assignment.
Analysis of molecular variance (AMOVA; Excoffier et al. 1992 ) was calculated using Genalex v. 6.4 (Peakall and Smouse 2006) at three hierarchical levels: among populations, within populations, and among the genetic clusters assigned by STRUCTURE analysis. This test partitions total genetic variance and calculates ΦPT, an analogue of FST. Significance was tested against a null distribution of 10,000 random permutations. Private alleles (alleles exclusive to a given population) were also calculated in Genalex v. 6.4.
The extent and significance of the genetic differentiation among geographic populations was investigated with Microsatellite Analyzer (MSA) v. 4.05 ( Dieringer and Schlötter 2003) by calculating global and pairwise F ST (θ; Weir and Cockerham 1984 ) values averaged over multiple loci among the geographic populations. The significance of FST values was tested with 10,000 permutations using Bonferroni corrected P-values at (α = 0.01). FreeNa ( Chapuis and Estoup 2007) was also used to estimate pairwise F ST values (FST (ENA)) from genotype frequencies corrected for the presence of null alleles [using the excluding null alleles (ENA) method of Chapuis and Estoup 2007] that have the potential to positively bias FST estimates.
A principal coordinate analysis (PCO) was used to examine the extent of genetic clustering of populations throughout Hawai‘i. The chord distance (DC; Cavalli-Sforza and Edwards 1967) between populations in Genalex v. 6.4 (Peakall and Smouse 2006) was used. Within each population sampled, duplicate genotypes derived from plants occurring less than 10 m from one another were identified (63 individuals) and were omitted from analyses of population genetic structure. It was hypothesized that these duplicate genotypes are either branches of the same plant that over time separated from one another or else artifacts of extreme genetic sub-structuring within certain populations, and that they would inflate measures of genetic structure between populations. Duplicate genotypes omitted from the Kaena Point NAR population (48 of the 63) are all purported to have been outplanted individuals derived from seeds collected when the natural population had been drastically reduced (Betsy Gagné, personal communication). The exceptions were the Windward O‘ahu and Mānā (Kaua‘i) populations, where duplicate genotypes (progeny of the same parent plants) were maintained in the dataset to support slightly larger sample sizes in these remnant groups of plants.
results
Approximately 1,035 base pairs (bp) were sequenced (720 bp of ITS and 315 bp of TRPT) of 22 samples of Sesbania tomentosa [End Page 454] from 16 populations on seven Hawaiian Islands plus S. marchionica (Marquesas). There was no sequence divergence whatsoever across the 22 Hawaiian samples sequenced for ITS and TRPT. In the Bayesian analysis, S. marchionica from the Marquesas was found to be closely related to a monophyletic Hawaiian Sesbania clade ( Figure 2).
The number of alleles per locus averaged 13.5 (ranging from 9 to 21), for a total of 122 alleles among the 459 samples for the nine microsatellite loci examined. Each locus had two to four alleles with a frequency greater than 0.1, and these most-common alleles had average frequencies per locus that ranged from 0.17 to 0.28 (with a maximum across loci of 0.50). None of the 35 tests for multiple comparisons between loci (genotypic disequilibrium) in Genepop were significant at the 5% nominal level after Bonferroni corrections when averaged over all populations. Thus, the different microsatellite loci can be considered to provide independent information on population structure.

Bayesian analysis (GTR Model) of the combined ITS and TRPT datasets of Sesbania tomentosa , S. marchionica, S. vesicaria, S. formosa, and S. grandiflora samples using S. herbacea as the outgroup. Posterior probabilities listed above branches. Hawaiian samples identified by their geographic population of origin.
Micro-Checker indicated that there was a general excess of homozygotes. These were evenly distributed across allele size classes at all 9 loci in an average of 11 out of 16 populations per locus, an indication of possible null alleles or false homozygotes in the data set. A maximum likelihood estimate of frequencies of null alleles per locus in each population (using the ENA method implemented in FreeNa) ranged from 0.000 to 0.404 (an exception being the Ka‘ena point populations that ranged from 0.980 to 1.000 at locus A122). When averaged over loci, the estimated frequency of null alleles in the 16 [End Page 455] populations varied from 0.040 to 0.340. The mean null allele frequency over all populations and loci was estimated to be 0.149.

Structure graph for the most likely number of clusters of Hawaiian Sesbania according to the ΔK method (K = 2). Individuals are presented as thin vertical lines, and colors indicate the degree of membership of each individual in each of 2 genetic clusters (red and orange). Black lines distinguish populations: 1. Kīpuka Nēnē–Hilina pali; 2. Pepeiau–Kukalau‘ula pali; 3. Kamo‘oali‘i–Kū‘ē‘ē; 4. ‘Apua point; 5. Kamilo point–Ka Lae; 6. Waiaka‘īlio; 7. Pu‘u Koa‘e; 8. Papanalahoa–Nākālele; 9. Pu‘u Pīmoe; 10. Kawela–Kamiloloa; 11. Mo‘omomi; 12. Kāohikaipu & Mōkapu; 13. Ka‘ena point; 14. Mānā; 15. Polihale; 16. Nihoa. Island of origin for each population listed at top of figure.
Two distinct genetic groups were found using STRUCTURE (following Evanno et al. 2005) among Sesbania tomentosa individuals sampled across all islands (Figure 3). The largest increase in the posterior probability occurred at K = 2, suggesting that this was the best model for the data (Figure 3). Three genotypes are evident in STRUCTURE analysis corresponding to populations from Hawai‘i Island (red), from Nihoa, Kaua‘i, O‘ahu, and most of one population on Maui (orange), and admixed collections from Kaho‘olawe, Maui, and Moloka‘i (with Lāna‘i, collectively referred to as Maui Nui; Price and Elliott-Fisk 2004 ). The non-admixed populations showed a high proportion (90–100%) of individuals assigned to one group only. The admixed populations were proportionally more similar to the Nihoa–Kaua‘i–O‘ahu cluster. On Maui Nui, population membership coefficients in the orange cluster had proportions much lower (average 0.81, ranging from 0.69 to 0.94), indicating levels of admixture much higher than the 5% threshold that could be attributed to stochastic noise. In addition, cluster membership coefficients of Maui Nui individuals also averaged low (average 0.71, ranging from 0.68 to 0.74; Figure 3).
Additional analysis of the two genetic demes described was carried out. The Hawai‘i Island cluster found K =2 (Figure 4) comprised of sub-cluster (orange) of the Hawai‘i Volcanoes National Park populations plus a small remnant population in North Kohala (Waiaka‘īlio) and the sub-cluster (yellow) comprising the combined populations from the South Point region (Kamilo Point–Ka Lae).
Further analysis of the cluster consisting of the remaining islands found K = 4 and indicate two groups in the STRUCTURE plot that distinguish the Maui Nui and Nihoa–Kaua‘i–O‘ahu populations (Figure 5). Each of these groups is comprised of two genetic demes. First, populations on O‘ahu and Kaua‘i separate out into a distinct sub-cluster (pink) from the relatively large population on Nihoa, 250 km to the northwest of Kaua‘i (mauve). One individual from Kaua‘i had a genotype mirroring Nihoa plants and one population on Kaua‘i (Mānā) was almost equally mixed between Nihoa and O‘ahu–Kaua‘i genotypes. Among Maui Nui populations, Kaho‘olawe (Pu‘u Koa‘e) and one Maui population (Papanalahoa–Nākālele) were largely uniform in their genetic constitution. Levels of admixture were highest in the populations on Moloka‘i. For example, the combined (modern plus historical) Mo‘omomi population was not definitively assigned to any one particular genetic group, the highest proportion of individuals (0.44) being assigned to the red cluster, shared with Pu‘u Koa‘e on Kaho‘olawe and the admixed Pu‘u Pīmoe on Maui. While the population at Kawela–Kamiloloa was definitively assigned to the [End Page 456] red cluster, the proportion of individuals assigned to that cluster was relatively low (0.80), and 3 individuals failed to be assigned to any cluster at the 0.50 cut-off. Cluster membership coefficients for the Moloka‘i individuals from both populations (with respect to their assigned cluster) averaged moderately low as well (0.70 and 0.87), similar to Pu‘u Pīmoe on Maui (0.85) where another individual failed to be assigned to any cluster at the 0.50 cut-off. When considering the ten historically collected samples from Mo‘omomi separately, cluster membership coefficients averaged low at 0.72, and individual cluster assignments varied widely (indicating admixture).

Structure graph for the most likely number of sub-clusters on Hawai‘i Island (red cluster of Figure 2) according to the ΔK method ( K = 2). Individuals are presented as thin vertical lines, and colors indicate the degree of membership of each individual in each of 2 genetic sub-clusters. Black lines distinguish populations: 1. Kīpuka Nēnē–Hilina pali; 2. Pepeiau–Kukalau‘ula pali; 3. Kamo‘oali‘i–Kū‘ē‘ē; 4. ‘Apua point; 5. Kamilo point–Ka Lae; 6. Waiaka‘īlio.

Structure graph for the most likely number of sub-clusters in the orange cluster of Figure 2 according to the ΔK method ( K = 4). Individuals are presented as thin vertical lines, and colors indicate the degree of membership of each individual in each of 2 genetic sub-clusters. Black lines distinguish populations: 7. Pu‘u Koa‘e; 8. Papanalahoa–Nākālele; 9. Pu‘u Pīmoe; 10. Kawela–Kamiloloa; 11. Mo‘omomi; 12. Kāohikaipu & Mōkapu; 13. Ka‘ena point; 14. Mānā; 15. Polihale; 16. Nihoa. Island of origin for each population listed at top of figure.
An analysis of molecular variance (AMOVA) revealed that 55% of the genetic variation was found within Hawaiian Sesbania populations, 30% distributed among populations, and only 15% distributed among the three regional genetic associations/genotypes assigned by STRUCTURE analysis (i.e., Hawai‘i Island, Maui Nui, and Nihoa–Kaua‘i–O‘ahu) [End Page 457] (ΦPT = 0.450; df = 453, P =. 000; Table 3). Global F ST (u) over all populations (averaged over loci) was 0.40 (P < .001); correction for null alleles using the ENA method (Chapuis and Estoup 2007 ) reduced this value slightly to 0.37 (P < .001, Table 4). Similar to AMOVA, this analysis indicates that much of the total genetic variation found across the range of Hawaiian Sesbania is ascribable to genetic difference (differences in allele frequencies) among geographic populations. Pairwise comparisons of θ-values and ENA corrected values for each population combination were made. Results indicate that correction for null alleles only marginally decreased pairwise θ-values, indicating that null alleles were not strongly biasing the analysis of genetic differentiation among populations (Table 5).

Results of AMOVA (Excoffier et al. 1992) at Three Hierarchical Levels Among Three Regional Genetic Clusters (Hawai‘i Island, Maui Nui, and O‘ahu-Kaua‘i-Nihoa) Assigned by STRUCTURE Analysis Within and Among All Populations of Hawaiian Sesbania

FST (θ) per Locus and Global Overall Populations ( FST)
Co-dominant genotypic distances (ΦPT) were also used in a principal coordinates analysis (PCO) to examine the extent of genetic grouping of Hawaiian Sesbania populations throughout the archipelago (Figure 6). Principal coordinates (PC) axes one and two account for 39.2% and 18.2% of the genetic variation (57.4% combined), respectively. A strong geographical correlation is evident. Axis one differentiates populations from O‘ahu, Kaua‘i, and Nihoa from Maui Nui and Hawaii Island. Axis two distinguishes Nihoa plants from Kauai and Oahu populations, and Hawaii Island populations are distinct from Maui Nui populations with the exception of Waiaka‘īlio. There were two alleles (at separate loci) private to the populations on O‘ahu, Kaua‘i, and Nihoa (average frequency 0.090; ranging from 0.004 to 0.173). There were eleven private alleles on Hawai‘i Island at seven loci (average frequency 0.020; ranging from 0.005 to 0.065). The largest number of private alleles (16 occurring at eight of nine loci) were found in the arborescent Sesbania population on SE Moloka‘i (Kawela–Kamiloloa; average frequency 0.05; ranging from 0.01 to 0.16), occurring in 60% of the individuals randomly sampled from a population that was estimated to number several hundred plants at that time. The only other population of arborescent [End Page 458]

Pairwise FST-Values Among Populations of Hawaiian Sesbania
[End Page 459]
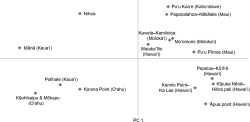
Principal coordinate analysis (PCO) of the chord distance (DC; Cavalli-Sforza and Edwards 1967) between populations of Hawaiian Sesbania.
Sesbania harboring any private alleles (Pu‘u Pīmoe, Maui) had just a single allele unique to that population, further distinguishing the SE Moloka‘i arborescent population from all the others. When all of the remaining populations of Maui Nui were considered together (excluding the Kawela–Kamiloloa population of SE Moloka‘i), there were six private alleles at four loci (average frequency 0.090; ranging from 0.004 to 0.292).
discussion
Phylogenetic Implications
The molecular DNA phylogeny was unable to suggest any meaningful relationships among populations of Hawaiian Sesbania. DNA sequence data obtained with conventionally used gene regions will not be able to resolve phylogenetic relationships among the morphologically variable Hawaiian populations. In spite of this, it appears that all Hawaiian Sesbania populations form a monophyletic group and represent a recent evolutionary radiation among the Hawaiian Islands.
Hawaiian Sesbania populations were shown to share a close relationship with S. marchionica Lorence from the Marquesas. Fosberg (1948) suggested that the presumed origin of Hawaiian Sesbania is somewhere in the South Pacific given the morphological similarity to other Pacific (S. coccinea, S. marchionica, and S. grandiflora) and Austral (S. formosa) species. However, the data here show evidence for an American origin, consistent with the cosmopolitan Sesbania phylogenies previously published (Farruggia and Howard 2011, Farruggia et al. 2018).
Reproductive Ecology Impacting Rapid Diversification
Sesbania taxa worldwide are known to be extremely successful in establishing themselves by producing fertile seed from self-fertilization ( Jamnadass et al. 2005). Growth and regeneration of Sesbania tomentosa are characteristic of pioneer species associated with harsh environments (Odum 1971). Maturation of the species is rapid (plants can develop from seed to maturity in less than one year), soil seedbanks have been demonstrated to be “persistent” (Pratt et al. 2011), and seeds are viable up to 15 years in ex situ storage (Chau et al. 2019). Plants typically have a short life span with longevity reported to vary from three to ten years at Ka‘ena Point (Hopper 2002), as is the case with most [End Page 460] Sesbania species worldwide. Flush-crash cycles have been observed several times at multiple locations (e.g., Polihale, Pu‘u Koa‘e, Ka Lae), allowing drift to repeatedly impact populations and effectively enhance divergence. These characteristics of the plant’s growth and reproduction indicate a high probability of genetic bottlenecks taking place in populations of S. tomentosa (examined in Cole 2015), similar to S. sesban in sub-Saharan Africa ( Jamnadass et al. 2005).
A large proportion of the pollination and fruit set observed for S. tomentosa is believed to be the result of geitonogamy (fertilization via pollen from a separate flower on the same individual), consistent with the behavior of the Hylaeus sp. (yellow-faced bee) pollinators (Hopper 2002). Hopper (2002) observed Hylaeus to spend most of their time around a single Sesbania plant and believed Hylaeus will not forage far unless there is native dominated vegetation containing both nectar and pollen, and sites for resting and/or nesting. In addition, a single S. tomentosa plant in full bloom would supply much more pollen than an individual bee could carry back to its burrow, reducing the need for visits to multiple plants that might otherwise facilitate cross-pollination. Therefore, the behavior of the vector most responsible for effecting pollination in S. tomentosa (playing a much larger role than all other floral visitors combined; Hopper 2002, Pratt et al. 2011) would facilitate inbreeding, and the plant would therefore be more dependent upon the less common occurrence of seed dispersal for geneflow. This inbreeding would promote a loss of allelic diversity and increase genetic drift, thereby increasing genetic differentiation between populations.
It is possible that cross-pollination in S. tomentosa in the past may have been carried out by specialist honeycreeper finches (Fringillidae) (Sheila Conant, personal communication). Flowers are nectar-rich, scentless, and showy, all traits that would attract honeycreepers and potentially provide a large proportion of pollination services. As such, the birds would have provided for greater outcrossing within and among populations than is seen at present. However, habitat loss and the introduction of avian diseases ( Atkinson and LaPointe 2009) would have extirpated species from these habitats resulting in a shift to being solely insect pollinated (with Hylaeus spp.) and severely limiting geneflow within and among populations. Genetic evidence of population sub-structuring was found throughout extant populations of Sesbania tomentosa (Cole 2015), indicating that adjacent plants are more closely related than non-adjacent plants.
The original immigration of Sesbania to Hawai‘i need not have taken place very far back in the past to account for the morphological differentiation observed today, and is probably the case given the low levels of nDNA sequence divergence observed. Natural selection in different environments, along with random drift and mutation, would cause morphological variation to accumulate in the species as a whole. Rates of adaptation and morphological change in naturally fragmented and isolated breeding populations would be impacted by the rapid maturation of S. tomentosa, the maintenance of a viable seed-bank and the flush-crash cycles of individuals. The maintenance and fixation of unique morphological and genetic characters in populations separated over limited spatial scales is facilitated by these and the other aforementioned factors of the plant’s reproductive ecology. In other areas around the world, flooding events along riparian corridors play a major role in dispersing Sesbania and promoting the growth and expansion of more uniform and continuous populations; Hawaii’s terrain might be limiting the capacity of this plant to move inland.
Patterns of Diversification in Hawaiian Sesbania
Overall, STRUCTURE provided less resolution in identifying distinct clusters (or lineages) than FST (θ). This is a result of a poor fit between the assumptions of the STRUCTURE model, which assumes Hardy–Weinberg equilibrium within populations, and the empirical data (Evanno et al. 2005). Wright’s (1978) guidelines (based on allozyme variation) state that values of FST above 0.25 indicate “very great” genetic [End Page 461] differentiation. As a point of comparison, many of the population pairs analyzed here far exceed this level of differentiation. The high F ST values observed among S. tomentosa populations are comparable to rates of differentiation seen in other predominately selfing, short-lived perennial species (Hamrick and Godt 1996). Mating systems have been shown to play the dominant role in shaping genetic structure measured by FST (Duminil et al. 2009). In our study, the consistency of the homozygote excess across the nine loci and their respective allele size classes indicates that nonrandom mating (e.g., mating of close neighbors or self-pollination) must be occurring.

Map of Sesbania tomentosa genetic groups and populations in the Hawaiian Islands. The three genetic groups are circled; numbers correlate with populations listed in Table 1. Pie charts indicate a population’s approximate location and proportion of membership in two genetic clusters (orange and red) assigned by STRUCTURE analysis. Brief morphological descriptions of populations within the three genetic groups are listed with emphasis on growth habit and leaflet indument.
The results presented herein provide a basis for beginning to understand the apparent diversification of Hawaiian Sesbania populations. When two or more loci indicate that a lineage is distinct, that group of populations would normally become a candidate for species recognition. Indeed, STRUCTURE is often useful in determining the lower bounds of potential species (Shaffer and Thomson 2007, Lu et al. 2016). However, with regards to their morphology, each of the three genetic groups of Hawaiian Sesbania are broad polymorphic entities ( Figure 7) as might be expected given the inbreeding and population sub-structuring throughout the range of the species. In addition, morphological similarities among populations outside of our genetic bounds are apparent in many instances suggesting convergent evolutionary processes are occurring towards similarly [End Page 462] divergent morphologies. As a result, formal sub-specific designations are not appropriate for Sesbania tomentosa. Managers are encouraged to preserve all of the various morphotypes and genetic populations within each of the three groups in accordance with an understanding of the plant’s reproductive ecology and its influence in sub-structuring populations on a small geographic scale. The maintenance of the wide range of distinctive appearing populations and morphotypes is facilitated by the natural tendency of the plant to self-isolate and fix traits within populations, perhaps mitigating undesirable outcrossing between natural populations and domestically-cultivated individuals.
The strong phylogeographic pattern of proximate (yet morphologically dissimilar) populations clustering together was evident from the results based on several lines of evidence. Patterns of morphological and genetic diversity among these three associations suggest colonization might have originally occurred on Maui Nui with subsequent dispersal to the southeast and northwest where only subsets of the Maui Nui diversity are retained due to founder effects and genetic drift. However, timing and directionality cannot be definitively determined due to lack of DNA sequence resolution between populations. Prostrate plants with dense sericeous tomentum, arborescent shrubs, and tall slender trees with glabrous leaves plus a range of intermediate morphologies are all known to be endemic to Maui Nui. Hawai‘i Island is seen as a genetic cluster distinct from all of the remaining island populations. This cluster comprises plant habits that range from prostrate to upright with trailing lower branches and semi-arborescent individuals, all with varying degrees of tomentum on leaflet surfaces. The hierarchical analysis suggests a separately evolving lineage comprised of the populations from O‘ahu, Kaua‘i, and Nihoa (corresponding with the isozyme analysis of Gemmill et al. 1995), where plants present as decumbent to erect shrubs with silky tomentose leaflets or small trees to 3 m with slender drooping branches and more glabrate leaflet surfaces (Figure 7).
Plants with an arborescent habit, while presently uncommon, are found in each of the three genetic clusters. This morphotype was formerly distributed much more widespread than at present; for example, remnant occurrences of arborescent plants have disappeared in the past 20 years at both Ka‘upulehu Hawai‘i and Līhau Maui. Hillebrand (1888), Remy (1893), and Rock (1920) observed plants with a distinct arborescent habit on islands (O‘ahu) and at locations (Mahana and Pālā‘au Moloka‘i and SE coast of Kīlauea) where they are no longer present. The completely prostrate and excessively tomentose morphotypes (hairs sometimes covering both the upper and lower mature leaflet surfaces) are a convergent evolutionary trend unique to Hawaiian Sesbania, and are found within all three of our genetic clusters. The leaflet morphologies displayed in Figure 8 illustrate various combinations of plant habit, leaflet hair and size traits in an arborescent shrub with fine hairs on long leaflets from Waiaka‘īlio, northern Hawai‘i Island (8a), a decumbent plant with dense silky tomentum on both sides of large elliptic leaflets from Mōkapu, O‘ahu (8b), and a 5 m tall tree with small hairless leaves from Kawela, Moloka‘i (8c).
Natural selection in different environments, along with random drift and mutation in fragmented (isolated) populations has likely caused Hawaiian Sesbania to separate out into the distinctive appearing populations we see today. Flush crash cycles, a preponderance of selfing, varied local environments, and reproductive isolation have all played a role in creating this diversity. Over the past century, populations have drastically declined in size or have disappeared, disrupting a more contiguous range of the species on an island and resulting in increased inbreeding within and differentiation among populations. Over half of the 52 populations of S. tomentosa recorded by naturalists have been extirpated since Lay and Collie’s first collection in 1826 (Hawai‘i Biodiversity and Mapping Program). Five populations have been extirpated over the 15 years since collections for this study were first made, and others have experienced severe [End Page 463] demographic decline due to drought, pest outbreaks, and other possible factors (USFWS 2015). A hermaphroditic breeding system, conspicuous flowers, and autochorous dispersal of dry fruit have made S. tomentosa acutely vulnerable to extinction compared with other dry forest taxa, according to the analysis of Pau et al. (2009). On the other hand, in the past decade wild plants suddenly appeared in native vegetation communities near Nu‘upia Pond (Mōkapu, O‘ahu) and at Pa‘akahi Point (Hanapēpē, Kaua‘i) after heavy winter rains. These discoveries highlight the important role of the seedbank and the ephemeral nature of the species as a component of the plant community, and lend hope for the future of this enigmatic example of plant evolution in the Hawaiian Islands.

Leaf morphologies of plants collected from (A) semi-arborescent plant at Waiaka‘īlio, Hawai‘i Island, (B) decumbent plant at Mōkapu, O‘ahu, and ( C) arborescent plant at Kawela, Moloka‘i. Note varying combinations of traits involving the size of leaves and leaflets, their degree of pubescence, and plant growth habit.
[End Page 464]
Plant Extinction Prevention Program, Pacific Cooperative Studies Unit, University of Hawai‘i at Mānoa, 19 East Kāwili Street, Hilo, HI 96720, USA. Corresponding author (e-mail: dmcole@hawaii.edu).
acknowledgements
Linda Pratt (formerly with USGS-BRD) and Tim Tunison (formerly with NPS) planted the seeds of this research and the painstaking dedication of Winona Pi‘ilani Char served as additional inspiration. The following organizations and agencies provided field assistance, access, and approval that allowed this research to be conducted: Hawai‘i Department of Land and Natural Resources Division of Forestry and Wildlife, State of Hawai‘i Natural Area Reserve System, Hawai‘i Volcanoes National Park, U.S. Fish and Wildlife Service, Department of Hawaiian Home Lands, U.S. Army National Guard, B.P. Bishop Museum, The National Tropical Botanical Garden, The Nature Conservancy, U.S. Coast Guard, Kawela Plantation Homeowners’ Association, Kohala Ranch, and the Maui Land and Pineapple Company, Inc. The following organizations and agencies provided the funding for this research: U. S. Geological Survey, National Park Service, National Tropical Botanical Garden and the Graduate Student Organization, the Ecology Evolution and Tropical Biology Program, and the School of Life Sciences (Botany Department) of the University of Hawai‘i at Mānoa. This is publication #111 from the School of Life Sciences, University of Hawai‘i at Mānoa.
