


Population Divergence and Evolution of the Hawaiian Endemic Sesbania tomentosa
(Fabaceae)
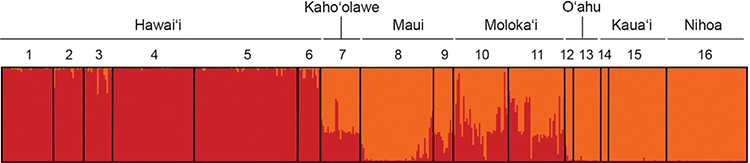
Structure graph for the most likely number of clusters of Hawaiian Sesbania according to the ΔK method (K = 2). Individuals are presented as thin vertical lines, and colors indicate the degree of membership of each individual in each of 2 genetic clusters (red and orange). Black lines distinguish populations: 1. Kīpuka Nēnē–Hilina pali; 2. Pepeiau–Kukalau‘ula pali; 3. Kamo‘oali‘i–Kū‘ē‘ē; 4. ‘Apua point; 5. Kamilo point–Ka Lae; 6. Waiaka‘īlio; 7. Pu‘u Koa‘e; 8. Papanalahoa–Nākālele; 9. Pu‘u Pīmoe; 10. Kawela–Kamiloloa; 11. Mo‘omomi; 12. Kāohikaipu & Mōkapu; 13. Ka‘ena point; 14. Mānā; 15. Polihale; 16. Nihoa. Island of origin for each population listed at top of figure.
