


Empirical Evidence of Population Concentration in Spain, 1900-2001
This paper examines the evolution of the population density in Spain over the twentieth century. Using a homogeneous database of the population at a municipal level - elaborated from the eleven censuses carried out between 1900 and 2001 - the paper looks at the general characteristics of population concentration from various perspectives. Focusing on population density, we present empirical evidence supporting the hypothesis that, over time, Spain's population has undergone progressive concentration, and that this process is still under way. Its main contribution is to offer quantitative support for phenomena which have already been well documented by specialists in more general terms.
Cet article traite de l'évolution de la densité de la population en Espagne au cours du XXe siècle. Exploitant une base de données démographiques homogène à l'échelle des municipalités - construite à partir des onze recensements effectués entre 1900 et 2001 - les auteurs examinent, sous divers points de vue, les caractéristiques générales de la concentration de la population. Les résultats corroborent l'hypothèse d'une concentration progressive de la population de l'Espagne au fil du temps, processus qui se poursuit encore aujourd'hui. L'apport essentiel de l'article est qu'il confirme par une analyse quantitative des phénomènes que les spécialistes ont déjà bien décrits en des termes plus généraux.
Este artículo versa sobre la evolución de la densidad de población en España durante el siglo XX. A partir de una base de datos de población a escala municipal homogénea- elaborada con los once censos efectuados entre 1900 y 2001 - los autores examinan, bajo distintos puntos de vista, las características generales de la concentración de la población. Los resultados corroboran la hipótesis de una concentración progresiva de la población con el transcurso del tiempo, proceso que prosigue todavía hoy. La aportación esencial del artículo es que confirma, por medio de un análisis cuantitativo detallado, fenómenos que los especialistas ya han descrito en términos más generales. [End Page 649]
This paper examines localization patterns of the population in Spain at the municipal level during the twentieth century. Over the course of this period the country underwent far-reaching social, economic and demographic changes. Some hesitant steps towards industrialization had been taken during the nineteenth century and the first three decades of the twentieth, but the second half of the latter century would see the industrialization "miracle" spread to all parts of the country. The accompanying change in the "quality of life" was to affect each member of the population in varying and multidimensional ways.
Two simple examples serve to show the extent of this change. Life expectancy more than doubled over the course of the century, rising from 34.8 years in 1900 (Instituto Nacional de Estadística, INE, 1952) to 79.4 years in 2000 (http://www.ine.es). The income per capita increased by a factor of ten in real terms, increasing from just under 250,000 pesetas in 1900 to more than 2 million pesetas (1995 pesetas) in 2000 (Prados de la Escosura, 2003), despite the fact that the population had more than doubled during this period.
These changes did not occur in a uniform way across time and space. Over the course of the twentieth century the population became increasingly concentrated (Zoido and Arroyo, 2004; De Cos and Reques, 2005). This uneven population distribution over the territory was already evident in 1900 (
The Spanish experience has therefore been similar to that of the large European cities (de Vries, 1984; Hohenberg and Lees, 1995), the difference being that the process was, to a certain extent, delayed. Our calculations corroborate those made on a regional scale by Ayuda et al., (2005, 2007). While the time perspective in these studies is more extended, the use of a geographical analysis unit larger than the municipality tempers the process of spatial population concentration. Martí-Henneberg (2005) obtained similar results at a regional European level.

Population density of Spanish municipalities in 1900
An exhaustive description of the process of population localization in Spain at a municipal level during the twentieth century is given in Goerlich et al. (2006). That study charts the varying pace of the progressive shrinking of small villages (the rural environment) in contrast to the growth of medium-sized towns and the burgeoning of the larger ones (the metropolitan areas). This shrinking and growth followed a marked spatial pattern: the interior underwent a process of depopulation and the periphery a process of densification. Madrid, the state capital, is the most notable exception in this process of population movement towards the coast (
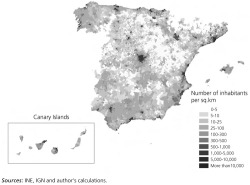
Population density of Spanish municipalities in 2001
As is the case with other authors (Ayuda et al., 2005, 2007), but unlike much of the literature (van der Woudee et al., 1990; Reher, 1990; Eaton and Eckstein, 1997; Black and Henderson, 2003), our interest focuses not only on large urban agglomerations or cities. Our analysis takes into account the small villages, of little importance in terms of population volume, but abundant in number and surface area.
1. Data sources
As a primary source of information this paper uses the municipal population figures of the eleven Spanish censuses that cover the period from 1900 to 2001 (the date of the latest census). Among the administrative divisions of national territory, the municipalities are the smallest units that have clearly designated boundaries, so population density can be calculated.
The municipal structure of Spain underwent substantial changes over the course of the twentieth century. The number of municipalities shrank considerably from 9,267 in 1900 to the 8,108 listed in the 2001 census. Moreover, [End Page 637] the municipal structure was substantially modified by fusions, separations and other kinds of alterations between the censuses. As a result, Goerlich et al. (2006) produced homogenized municipal population statistics starting from two basic principles: (i) populations are defined on the basis of a territorial criterion, the municipal boundaries, and (ii) the criterion that determines these territories is the existing municipalities recorded in the 2001 census.
Hence, this paper uses information on the homogenized resident municipal populations from the censuses conducted between 1900 and 2001, where this homogeneity is based on the municipal boundaries existing in the 2001 census. Data on municipal surface area is taken from the municipal database of the Instituto Geográfico Nacional (IGN) . It is worth noting that Martí-Henneberg (2005) faces similar problems of homogeneity in comparing historical population density data in Europe at a regional level, and he adopts a similar approach.
2. Population concentration: some basic facts
The population concentration can be quantitatively summarized in various ways. An index of concentration with an interesting decomposability property is the (second) Theil (1967) index, or mean logarithmic deviation, T* which can be applied to variables other than the one with which it is most frequently associated, i.e. the personal distribution of income. In our case we use the Theil index to study the population concentration as measured by population density at a municipal scale.
If di is the population density of municipality i, di = Pi/Km2i, and si is its relative surface area (with respect to the entire national territory), si = Km2i/nΣj = 1 Km2j, we can define the Theil index, T* as:
where μ is the arithmetic mean of densities weighted by the relative surface areas (μ = nΣi = 1sidi), is the geometric mean (ln
= nΣi = 1si ln di) and n is the number of municipalities. The mean logarithmic deviation has a minimum value of zero (if there is an even spatial distribution of population), but has no upper limit.
Figure 1 shows the evolution of T* for Spain, and offers two pieces of highly relevant information. The first is the sustained increase in population concentration over the course of the twentieth century. The second is the way in which the period from 1950-1981 (and in particular the decade of the 1960s) [End Page 638] stands out as that of highest polarization. This is in fact the period of strongest economic growth in Spain.
In this sense, it is interesting to relate the Theil index with income per capita (Table 1) to see that both indicators follow the same general pattern. In fact a simple correlation coefficient between the two variables is as high as 0.96 and the highest growth is achieved in the 1960s, which is when we find the highest increase in population concentration. The conclusion seems obvious: the concentration of people follows economic development, as predicted by the New Economic Geography theories, based on increasing returns (Fujita et al., 1999; Pons et al., 2007).

Population density (Theil index) in Spain, 1900-2001

Volume change in income per capita, Spain, 1900-2001
Table 2 shows the corresponding Theil indexes for the Spanish provinces. The majority of provinces present minimum values in either 1900 or 1910. In addition, the majority also reach the maximum value in 2001. [End Page 639]

Population density (Theil index) in Spanish provinces, 1900-2001
[End Page 640]
While the level of concentration continued to rise throughout the twentieth century in the majority of regions, those of the Balearic Islands, Barcelona, Madrid, Las Palmas and Vizcaya reached the maximum index value in 1981. From that year onwards the Theil index falls continuously. All these cases represent rich provinces with strong economic development, so this is an indication of the level of saturation of the regions and the relative decline of their respective metropolitan areas. From another point of view, it can be argued that this is an indication that municipal boundaries are not the right scale to study population concentration in certain cases.
Álava, Cadiz and Santa Cruz de Tenerife reached their point of maximum concentration in 1991. It is interesting to observe that all of these provinces (except Álava and Madrid) are on the coast, which has seen a marked increase in its tourism industry. Note that they include all the insular regions of Spain. In the remaining provinces, the concentration has done no more than increase at a sustained rate over the course of the century, with maximum values on the Theil index in 2001.
What this table suggests is that despite the general trend towards concentration (and growth), the experience of the regions in Spain has been of a diverse nature (Collantes and Pinilla 2003). This is where the additive decomposition property of T* an play an in=terl e n sting role.
Let us assume that the municipalities of the country taken as a whole are made up of H different, exhaustive and mutually exclusive groups represented by the index h 5 1, 2, 3, …, H. In our case, the H groups are the 52 Spanish provinces. Let nh be the number of municipalities of the h group and dh = (dh1, dh2, . . . , dhnh) its population density vector, so that dhi is the population density of the municipality i of group h. Letc us suppose that μ = (μ1, μ2, μ3, . . .,μH) is the vector of group means, with μh being the average density of group h, μk = nhΣi = 1shi dhi where shi is the relative surface area of municipality i with respect [End Page 641] to group h. Using this notation we can write μ = HΣh = 1shμh, where sh is the relative surface area of group h in the aggregate.
We can now express the global dispersion, as measured by T*, as the sum of two components: (i) the dispersion that exists within each of the groups, i.e. intra-group, or intra-regional dispersion, and (ii) the dispersion that exists between the different groups, i.e. inter-group, or inter-regional dispersion.
Moreover, the dispersion within the groups is obtained as a weighted sum of the dispersion indexes applied to each of the groups, where the weights sum up to one and reflect the relative importance (in terms of surface area) of each group. As far as the dispersion between groups is concerned, this is simply the application of T* to the average density of each group. To be precise:
We can think of decomposition [2] in the following manner. Let us suppose that within each group (province) we redistribute the population in such a way that all the municipalities have the same density. This means that the dispersion observed would be given by the inter-group component in [2], given that within each group the municipalities would be identical, T*h = 0, ∀h. Let us now suppose that the transfer of population occurs between groups until the average density of each group equalizes, and within each group the population is reassigned in a proportional way that does not alter the dispersion within the group. This means that the dispersion observed would come from the intra-group component in [2], given that the average density of the different groups would be identical by construction, μh = μ ,∀h.(1)
This decomposition, applied to the municipalities grouped according to province, is presented in Table 3. First, we see confirmation that the most important component in dispersion derives from the difference in the municipal densities within provinces. Almost two-thirds of the dispersion observed according to T* derives from this component. Consequently, in an analysis of population localization it is necessary to move to a smaller geographical scale than the regional one. The second conclusion is that a considerable portion of the concentration observed (the remaining one-third) derives from the differences in average density at a provincial level, i.e. differences between regions. Finally, it is confirmed that the dispersion between the average regional population [End Page 642] densities grew substantially over the twentieth century, in line with the growth on the global Theil index (T*) Therefore, the growth of both components (inter-group and intra-group) is parallel, and such that the relative participation of both remains approximately stable over time. In other words, the observed population concentration has not only accentuated the differences between the regions (Ayuda et al., 2005, 2007), but also the differences within the regions themselves (the intra-group or intra-regional component).

Theil index decomposition applied to the density of Spanish municipalities grouped by province, 1900-2001
The growth in the intra-regional component simply reflects the population concentration in the largest city within each region, generally speaking the capital,(2) and the accompanying evacuation of the smallest settlements (i.e. the urbanization effect, to which it is necessary to add, in the case of the interior provinces of Spain, the valley effect, or a movement away from the mountain areas, and in the case of the coastal provinces, the coastal effect, or a movement to the coast line). In fact for Spain as a whole, the population density of the capitals was 5.5 times the density of the nation in 1900 and 10.8 times at the beginning of the twenty-first century.
With very few exceptions (Badajoz, Cáceres and Cuenca),(3) at the beginning of the twentieth century, all capitals showed higher population density than the average of their region, and the tendency was again generally upward, with [End Page 643] only three exceptions. These are Barcelona, Cádiz and Madrid, which had lower population density in 2001 than in 1900. Once again, these results show that, in some cases, the municipal administrative division is not appropriate for the study of population concentration. In some cases, saturation of the physical space is such that larger geographical units, such as metropolitan areas, should be used.
3. Population concentration: some extensions
This section focuses on three further interesting characteristics of the spatial population distribution.
3.1. Average density, median density and asymmetry
We have already seen how the differences between the regional population densities have grown continuously over time (Table 3), although, generally, these densities have increased steadily. Nevertheless, nine provinces registered their lowest density in 2001, namely, Ávila, Cuenca, Huesca, Lugo, Ourense, Palencia, Soria, Teruel and Zamora. This occurred in Segovia, in 1991, and in Guadalajara, in 1981. The rest of the regions recorded their minimum values at the beginning of the twentieth century.
The situation is very different, however, if we consider the median density as the central measure of the spatial population distribution. That is to say, the population density which divides the distribution into two equal parts: half of the municipalities with a lower density, and half with a higher one. Table 4 shows the average and median density at a national level. The average density grows over time, indicating the increase in population, but the median density, while showing a slight growth at the beginning of the twentieth century, begins a sharp downtrend in the second half. The figures could not speak more eloquently: in the present day, half of the municipalities have fewer than 15 inhabitants per sq.km. This tells us quite clearly about the increasing asymmetry in the spatial population distribution. Moreover, the ratio between the median and the average can be taken as an indicator of concentration, given that it represents the slope of the Lorenz (1905) curve at the percentile 0.5. If the slope falls, as is continuously the case throughout the period under consideration, a smaller percentage of the population lives in the half of the municipalities with lower density, while a larger percentage lives in the half with higher density. In other words, some municipalities are heavily populated, whereas others are losing their inhabitants.
The contrast between the average and median density tells us about the progressive shrinking of the settlements of a more rural nature, typically low-density areas (Collantes, 2005, 2007). Given that the difference between these two figures can be taken as an indicator of asymmetry in a distribution, we can see a continuous increase in this asymmetric behaviour. [End Page 644]

Average density, median density (inhab./ sq.km) and asymmetry. Spain, 1900-2001
3.2. Persistence and the importance of history
Attention has frequently been drawn to the intense process of population concentration that occurred in the last century. It is, however, interesting to find out how persistent this has been in terms of the municipalities involved, a question that relates to intra-distributional mobility. A simple coefficient of correlation between the situation in 1900 and that in 2001 shows a moderate degree of persistence in levels, and a higher degree of persistence in rankings. In the aggregate, this correlation is 0.53 for levels and 0.78 for rankings at a municipal scale, even though the period under consideration spans a 100 years.(4) Hence, from the aggregate point of view, the persistence in the distribution is remarkable.
If we look solely at the initial (1900) and final (2001) situation, however, six municipalities register population losses of more than 10,000 inhabitants: La Unión (Murcia, with 13,983 habitants lost), Valdés (Asturias, with 11,896), Tineo, (Asturias, with 10, 756) Fonsagrada (Lugo, with 10,643), Salas (Asturias, with 10,591) and Cuevas de Almanzora (Almería, with 10,086). The predominance of the mining industry and its geography (Asturias, in the north of Spain) is evident. The mining settlements have been the big losers (in absolute terms) as far as population is concerned.
3.3. A divergent distribution
Finally, an alternative way of analysing these results is by means of an equation that relates the initial population density with the rate of subsequent density growth. This is the equation of unconditional ß-convergence of the economic growth literature (Barro and Sala-i-Martín, 1995). A negative relation between the initial position and the subsequent growth indicates convergence, in the sense that the municipalities with lower density tend to attract more people than the municipalities with more population density, while a positive [End Page 645] relation indicates divergence, the municipalities with higher density tending to attract more people, on average, than the ones with lower density.
For the period as a whole, and using logarithms, we obtain,
where ln (d2001) – ln(d1900) represents the density growth over the course of the whole century. The equation(5) is estimated by ordinary least squares, and the standard error of the coefficient (0.0215) is very robust (White 1980). We can see that the coefficient on the initial condition is positive and highly significant (t-ratio 19.47), which indicates a tendency towards the population concentration in a limited number of municipalities – generally those already more densely populated at the outset.
Conclusion
This paper offers an insight into changes in the spatial distribution of the Spanish population over the course of the twentieth century. To this end, we focus on the variable population density at a municipal scale and the data is provided by the population censuses between 1900 and 2001, conveniently homogenized according to the structure of the municipalities of the latest available census.
Contrary to many studies of population settlement, we focus not only on cities, however these may be defined, but on all existing settlements. Extremely small settlements are numerous in Spain. Half of the municipalities that exist today have fewer than 1,000 inhabitants and they form an important part of the rural geography.
Several basic characteristics of the population concentration in Spain (which in 1900 was already fairly concentrated in certain places) have been illustrated. This concentration increased over the twentieth century, particularly during the period from 1950 to 1981. Hence, the analysis presented supports the thesis that, in terms of population density, inequalities on a municipal scale have been exacerbated over time. This population concentration has produced: (i) wide discrepancies between regions which have increased over time, (ii) marked differences within regions, where the situations are very heterogeneous, (iii) a higher degree of polarization between the municipalities of the different regions, (iv) a quite strong persistence of the original positions [End Page 646] (territorial inertia), (v) symptoms of divergence, given that municipalities with higher population density tend to attract more population than municipalities with lower population density, and (vi) an increasing role of regional capitals in the concentration process, extending the influences on their respective hinterlands. The population tends to locate today in the same places as in the past. What has changed in a fundamental way is the intensity of the concentration process.
To sum up, the economic development of the twentieth century, especially in its second half, has resulted in a high concentration of the population in a reduced number of places, and this process is still ongoing.
Acknowledgements.
The authors are grateful to Pilar Chorén for help in processing the data, to the editors and to two anonymous referees for comments. Also to projects of the Ministerio de Ciencia y Tecnología/FEDER, SEC2005-02776, ECO2008-03813 and Fundación BBVA-Ivie research programme for financial assistance. Results mentioned in the text but not reported can be requested at francisco.j.goerlich@uv.es.
References
Footnotes
1. The argument put forward is parallel to that of transfer of income in the distribution of income analysis. The "transfers of population" are effectively possible due to the politics of development. During the 1950s and 1960s in Spain a large number of "colony towns" sprang up, which meant a real transfer of population between regions. An identical phenomenon occurred due to the construction of reservoirs.
2. There are only seven provinces in which the capital was not the largest municipality at the time of any of the twentieth-century censuses. Outstanding among them is the case of Pontevedra, whose capital, Pontevedra, has always been second in size to the municipality of Vigo. The other cases are Cádiz, whose biggest municipality since 1950 has been Jerez de la Frontera; Ciudad Real, where between 1900 and 1950 the biggest municipality was Valdepeñas, and between 1950 and 1981 Puertollano; Jaén, whose biggest municipality between 1900 and 1930 was Linares; Asturias, where Gijón was the biggest municipality in several censuses (1910, 1930, 1940, 1950, 1970, 1981, 1991 and 2001); Tarragona, where Reus was the biggest municipality in 1910 and 1920; and finally Toledo, where the capital lost its importance in terms of size to Talavera de la Reina between 1970 and 2001.
3. It is worth mentioning that the capital of Cáceres has the largest surface area of all municipalities in Spain, and the capital of Badajoz is third in the ranking.
4. This correlation is much higher at a provincial scale, reaching 0.987 for levels between 1900 and 2001.
5. From the point of view of time series, equation (3) represents an unstable first-order auto-regressive process. In this case, the usual estimators do not have the right properties to carry out statistical inference. Nevertheless, the equation (3) is based only on the cross-sectional dimension of our data and is perfectly valid for the statistical inference presented in the text. Ayuda et al. (2007) present similar results at the regional level, but over a somewhat longer time period.
