


Getting to know them: Effects of familiarity, identity, and modeling on the production of singular specific theySupplemental material
Related article: http://muse.jhu.g.sjuku.top/article/947039
[Download ZIP file] Supplementary file 1
This ZIP file contains the data, plots, and analysis code for the production experiments and image norming survey, as well as the stimuli used for experiment 2 from https://www.chicagofaces.org.
[Download ZIP file] Supplementary file 2
This ZIP file gives the complete results of the GLMER model for experiment 2.
The figures from the main article are repeated here in color, with their captions.

Distribution of difference scores (masculine − feminine) for ratings of the images used in experiment 1 by condition (feminine, masculine, or androgynous) and block (i.e. the block in which the image appeared in the primary study).

Example they trial from block 2 of experiment 1, consisting of two screens. In block 1, participants saw only a single screen containing the image and the three verbs on each trial.

Proportion of responses in experiment 1 from participants who identified as men or women. Each bar represents one of the examined pronouns (he, she, or they), by block and condition. Error bars indicate by-subject standard errors. In block 1, participants were not shown any pronouns for the pictured individuals. In block 2, each image was paired with a short description that included a pronoun (he, she, or they).

Proportion of androgynous trials in block 1 and block 2 in which participants produced singular specific they, by log-transformed self-reported familiarity with transgender, nonbinary, and LGBTQ individuals. Model fits shown are based on the model-predicted values when familiarity is varied while age is held constant. Participants identifying as men (n = 45) are represented with dark gray/blue dots and a solid line, and participants identifying as women (n = 67) with light gray dots and a dashed line.

Proportion of androgynous trials in block 1 and block 2 in which participants produced singular specific they, by log-transformed age. Model fits shown are based on the model-predicted values when age is varied while familiarity is held constant. Participants identifying as men (n = 45) are represented with dark gray/blue dots and a solid line, and participants identifying as women (n = 67) with light gray dots and a dashed line.

Proportion of responses in experiment 1 from participants who identified as (a) nonbinary or as (b) a trans-woman.
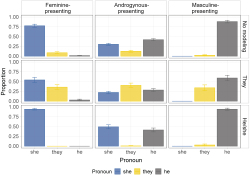
Proportion of responses in experiment 2 from participants who identified as men or women and neither transgender nor nonbinary (n = 127). Each bar represents one of the examined pronouns (he, she, or they). Each row represents the pronoun provided, and columns represent the image type. Error bars indicate by-subject standard errors.

Proportion of trials in which participants produced singular specific they when no pronoun was provided versus when the pronoun they was provided, by log-transformed self-reported familiarity with transgender, nonbinary, and LGBTQ individuals. Model fits shown are based on the model-predicted values when familiarity is varied while age is held constant. Panel (a) illustrates nonbinary images and (b) binary images. Participants identifying as men (n = 69) are represented with dark gray dots and a solid line, and participants identifying as women (n = 89) with mid gray dots and a dashed line; participants identifying as nonbinary (n = 77) or questioning (n = 5) are represented with light gray/yellow dots and a long dash line.

Proportion of responses in experiment 2 from (a) participants who did not identify themselves as LGBTQ and (b) participants who identified as LGBTQ. Each bar represents one of the examined pronouns (he, she, or they). Each row represents the pronoun provided, and columns represent the image type. Error bars indicate by-subject standard errors.
