


Agricultural Displacement and Deforestation Leakage in the Brazilian Legal Amazon*
Does environmental policy aiming to reduce deforestation induce displacement of existing agricultural activities? To shed light on this question, we exploit a difference-in-differences strategy with a distance-based treatment to examine whether two policies in the Brazilian Amazon, the Soy Moratorium and the Zero-Deforestation Cattle Agreements, have displaced production or deforestation into neighboring regions. Our results show evidence that the Soy Moratorium induced soy spillovers onto previously cleared land—mainly pasture—in the less regulated ecosystem. The spillovers from the Cattle Agreements, three years after the Soy Moratorium, resulted in increased deforestation.
Q18, O13
1. Introduction
Expansion of large-scale cattle and soy production in the Brazilian Amazon since the 1970s has led to high rates of deforestation. In response, the Brazilian government, international agencies and nongovernmental organizations (NGOs) have implemented numerous policies to deter deforestation (Assunção, Gandour, and Rocha 2013; Hargrave and Kis-Katos 2013; Assunção and Rocha 2014; Nepstad et al. 2014). These policies, along with changing economic conditions, contributed to deforestation declines in the Brazilian Amazon from an average of 17,000 km2 in the 1990s and the 2000s, to an average of 6,200 km2 from 2010 to 2016. However, relatively little attention has been paid to the neighboring less protected regions. Do antideforestation policies push agricultural activities into less protected regions? If there is leakage of these activities, is the end result intensification on existing agricultural land or expansion into unprotected forests?
We analyze whether two policies implemented in major Amazon commodity supply chains, the Soy Moratorium (SoyM) and the Zero-Deforestation Cattle Agreements (CA), have caused soy, cattle, and deforestation spillovers from the Amazon ecosystem into the less regulated Cerrado ecosystem. The SoyM and the CA were initiated following international scandals that linked the production of soy and cattle with deforestation in the Amazon. The SoyM began in 2006 and prohibited soy traders from buying soy grown on land deforested after 2006. The CA began in 2009 and mandated that slaughterhouses refrain from buying cattle from properties with deforestation after 2009. These supply chains policies are enforced only in the more regulated ecosystem, the Amazon biome.1
To identify agricultural displacement and deforestation leakage, we exploit a difference-in-differences strategy where the treatment is proxied linearly by distance to the spatial boundary of the Cerrado biome. Using [End Page 155] grid cells and municipality observations, we estimate the effect of a discrete and a continuous treatment variable based on this distance. Because some types of agricultural displacement and deforestation leakage could affect the whole market and not be specific to distance, our strategy identifies a lower bound. Two critical assumptions underlie the validity of this identification strategy. First, the causality of our estimates depends on the parallel trend assumption, that is, in the absence of the supply chain policies, the areas closest to the biome border should have behaved similarly to those farther from the border. Second, our theoretical framework suggests that spillovers should occur disproportionately more in the areas closest to the biome border compared with those farther from the border.
We specifically investigate the state of Mato Grosso, which covers 904,000 km2 and is divided among the Amazon biome (54%), the Cerrado biome (40%), and the Pantanal biome (6%).2 The Amazon portion of Mato Grosso had very high deforestation rates with a peak in 2004 of almost 12,000 km2, followed by a large decline in deforestation rates (INPE 2017). This state is responsible for approximately 85% of the Brazilian Amazon soy production (Kastens et al. 2017), and 9% of the global supply (IDH 2017), with a total production of about 55 million tons harvested in 2014 (Mato Grosso COP21 2015). It is the top producer of beef, supplying both domestic and international markets. Because Brazil is the biggest producer and exporter of beef (FAS/USDA 2017) and exporter of soy (OEC 2017), Mato Grosso is a predominant agricultural actor in the world. In brief, the inherent biomes division of that state offers an ideal context to study empirically agricultural displacement and deforestation leakage.
Our estimation strategy is consistent with empirical observations of and microeconomic theory about the locations of firms in different regulation contexts. Polluting companies can be attracted by weaker enforcement policies (e.g., Becker and Henderson 2000; Mulatu and Wossink 2014) and proximity to current investments (Le Polain de Waroux et al. 2016). Because they generally depend on input and services, the prices of which are influenced by transportation costs, farming companies prefer proximity to agricultural clusters (e.g., Garrett, Lambin, and Naylor 2013) to facilitate scale economies (e.g., Brainard 1997). In South America, agricultural actors in the Amazon are mobile and respond to opportunities and changes that pertain to the legal aspects of land use; furthermore, cattle ranching companies are more likely to buy forested land in regions with fewer or less enforced environmental regulations (Le Polain de Waroux et al. 2016).
One type of producers would be particularly affected by the biome-specific environmental policy: medium- to large-scale farmers who already own a farm in the Amazon biome and face intensification constraint. Theory suggests that established firms seek to minimize their transportation costs to maximize profits. When an agribusiness operates in an ecosystem that suddenly becomes more regulated, the owners may need to decide in which ecosystem to invest. Under the scrutiny of government regulations and international actors that can direct negative marketing campaigns against the sector, agricultural expansion may be preferable in the less regulated and less scrutinized ecosystem.3 Then, to minimize transportation costs among existing properties and new ones, expansion should occur in the less regulated ecosystem as close as possible to the existing properties.
We find evidence that the SoyM induced agricultural displacement into the less regulated ecosystem, the Cerrado biome. Within 100 km of the frontier with the Amazon, soy production increased by 31% (approximately 850,000 ha) relative to the region farther from the Amazon during 2007–2013. We show that the CA caused an increase in the cattle herd of 24.6%, or approximately 410,000 head, in the proximate region relative to the more remote region over 2010–2013. The agricultural displacements resulted in deforestation leakage of 10,700 ha in the biome adjacent to the Amazon, an increase of 12.7% compared with before the policies. [End Page 156]
We assess the robustness of our estimates to a number of deviations from our main framework. First, all our results are robust to the use of 10 × 10 km grid cells instead of 5 × 5 km. Second, our results are robust to four different specifications of the distance treatment variable. Third, estimates are stable when we execute a broad set of robustness checks with confounding variables as well as other policies, such as protected areas. Fourth, we support with falsification tests that the results are not likely driven by agricultural infrastructure or by municipal priorities leading to greater investment near the Amazon border. Fifth, we confirm that a municipal outlier is not causing our results by investigating the influence of all possible individual municipalities on our main parameter estimates.
To complement our findings, we analyze patterns of extensification versus intensification in soy with a rich spatial dataset of soy production in Mato Grosso (Kastens et al. 2017). We approximate extensification, with the technique of soy single cropping (growing and harvesting one crop per year on the same land), and intensification, with the technique of soy double cropping (sequentially growing and harvesting two crops per year on the same land). Results support that soy intensification did not occur in the Cerrado but extensification was privileged. As a way to understand land use dynamics, we analyze trends in soy expanding on pasture and find that it could have created land market adjustments between the soy agribusinesses and the ranchers. Following the increased purchase of pasture lands by soy agribusinesses, ranchers searching for cheaper land would have increased deforestation.
This article makes three main contributions. First, we contribute broadly to the literature on leakage and, more specifically, to the deforestation leakage literature; such leakage is defined as the shift of deforestation activities from inside protected regions to outside protected regions (Angelsen 2010). In terms of supply-chain policies, this study is the first to estimate deforestation leakage from the SoyM and the second to estimate deforestation leakage from the CA (see Alix-Garcia and Gibbs [2017] for the first analysis). Policy makers and researchers are increasingly interested in the consequences of incomplete or differentiated environmental regulations that can restrict industrial activity (Greenstone 2002; List et al. 2003), create pollution havens (Eskeland and Harrison 2003; Herath, Weersink, and Carpentier 2005; Hanna 2010; Mulatu and Wossink 2014; Millimet and Roy 2015) or lead to leakage where regulation is weaker or does not apply (Copeland and Taylor 2004; Fowlie 2009; Alix-Garcia, Shapiro, and Sims 2012; Arriagada et al. 2012). Literature on the effect of asymmetric environmental regulation and comparative advantage among industries has heretofore mainly concentrated on the analysis of leakage in air pollution or greenhouse gas emissions. Studies have addressed leakage effects from different antideforestation policies including payments for environmental services (e.g., Wu 2000, 2005; Roberts and Bucholtz 2005, 2006; Lichtenberg and Smith-Ramírez 2011; Alix-Garcia, Shapiro, and Sims 2012; Delacote, Robinson, and Roussel 2016), timber restrictions in the United States (e.g., Wear and Murray 2004), the blacklisted municipality program in Brazil (e.g., Cisneros, Zhou, and Börner 2015; Assunção et al. 2019) and protected areas (e.g., Robalino, Pfaff, and Villalobos 2017; Amin et al. 2019). We distinguish ourselves from the existing literature by estimating the supply chain policies leakage and using a novel methodology, that is, we identify the effects of environmental policies in the Amazon biome on deforestation in the Cerrado biome.
Second, our context allows us to estimate not only the leakage in deforestation but also the agricultural displacements in soy and cattle. These agricultural displacements demonstrate credible mechanisms that support the deforestation leakage results. They show how agribusinesses change their behavior to avoid stricter environmental policies.
Third, the combination of our results on agriculture displacements and deforestation leakage contribute to the literature of indirect land use change. Indirect land use change occurs when one land use displaces another, so that the second land use expands in another region, sometimes at the expense of forests (Andrade de Sá, Palmer, and Di Falco 2013). In Brazil, two main crops (sugarcane and soy) are responsible for most of the indirect land use change that has been quantified in recent [End Page 157] research.4 Moreover, indirect land use change has typically been shown to manifest in the following way: crops expand into pastures, pushing pasture into forest (Barona et al. 2010; Lapola et al. 2010; Arima et al. 2011; Mendonça, Loureiro, and Sachsida 2012; Andrade de Sá, Palmer, and Di Falco 2013; Ferreira Filho and Horridge 2014; Graesser et al. 2015). Diverging from the common literature, we reveal how this indirect land use change is accelerated by the SoyM and the CA.
2. SoyM and CA
In developing countries, states often face challenges in managing environmental regulation, for example, regulations may be in place but only superficially enforced. The Brazilian government and its antideforestation regulations are no exception, although enforcement has improved in recent years.5 In this low-enforcement context, international and national NGOs denounced the agricultural processes driving deforestation in the Brazilian Amazon; to modify agricultural practices, they targeted soy and cattle sectors and created negative publicity campaigns. Because the soy and cattle markets are concentrated in the hands of relatively few actors in the region, environmental activists used the agribusinesses corporations’ visibility as an asset to force change. The NGOs campaigns and political pressure led to the signature of two antideforestation agreements in which the signatories have been charged with the responsibility of excluding properties with recent deforestation (Gibbs, Munger, et al. 2015; Gibbs, Rausch, et al. 2015; Lambin et al. 2018). These agreements have also been supported in various ways by the Brazilian government and other private actors.
The SoyM was the first to be implemented following a Greenpeace-sponsored campaign against deforestation linked to the Brazilian soy industry. Starting in July 2006, the Brazilian Association of Vegetable Oil Industries, the National Grain Exporters Association, and commodity traders that purchase around 90% of the soy produced in the Brazilian Amazon (ADM, Bunge, Cargill, and others) agreed to boycott farmers who grew soy on land cleared after 2006 (Rausch and Gibbs 2016). The Banco do Brasil (a major Brazilian bank) further incentivized this agreement by restricting credit to farmers who deforested after the same date (ABIOVE 2010). The Soy Moratorium Working Group (composed of traders, NGOs, and government agencies) manages the satellite monitoring system of the supply chain policy (GTS 2014). By overlaying yearly deforestation imagery from the Brazilian Space Agency (PRODES) and crop production after 2006 (MODIS), the monitoring system detects the noncompliant producers and creates a list of them. The traders that signed the SoyM use the list to avoid noncompliant purchases. Simultaneously, soy traders are encouraged to boycott production on embargoed areas.6 A recent study by Heilmayr et al. (2020) shows that the SoyM reduced deforestation in the Amazon biome by 17,834 km2. Previous research also suggested that policy has been effective (Rudorff et al. 2011; Macedo et al. 2012; Gibbs, Rausch, et al. 2015; Kastens et al. 2017; Svahn and Brunner 2018). However, the SoyM may indirectly have caused deforestation if soy expanded on pasture (rather than expanding on land deforested after 2006) and as such, could have created some reallocation of land between soy producers and cattle ranchers. In addition, although soy expansion on recently cleared land decreased dramatically in the Amazon biome, it has remained stable in the Cerrado biome (Gibbs, Rausch, et al. 2015).
Inspired by the signature of the SoyM, Greenpeace led a new campaign, this time [End Page 158] linking the Amazonian cattle sector to deforestation. In 2009, major meatpackers (JBS, Marfrig, Minerva, and Berlin, later incorporated by JBS) signed the G4 agreement in which they agreed to buy from direct suppliers that were registered, mapped, not in protected or indigenous areas, and free of embargoes or deforestation after 2009 (Greenpeace 2009). Simultaneously, legal suits and other actions from federal prosecutors in Brazil sustained the implementation of the policy. In the state of Pará, the prosecutor filed a billion-dollar lawsuit against the cattle industry that spans ranchers, retailers, and slaughterhouses. In 2009, 21 lawsuits led to the signing of 140 legally binding terms of adjustment of conduct (TACs)—the federal counterpart of the G4 agreement. Between 2009 and 2013, an additional 24 lawsuits stimulated the signing of 42 TACs by other slaughterhouses in the Brazilian Amazon. In these TACs, slaughterhouses agreed to exclude suppliers with illegal deforestation.
To determine deforestation on their suppliers’ ranches, major meatpackers often rely on services from a geospatial firm to support their monitoring system. Composed of the G4 and the TACs, the CA is monitored only in the Amazon biome.7 To date, few studies have analyzed the effects of this supply chain policy. JBS, the largest beef exporter in the world, has been shown to statistically alter its purchase behavior and boycott suppliers with deforestation following the CA in Pará (Gibbs, Munger, et al. 2015); JBS also increased purchases from properties with deforestation in Mato Grosso’s Cerrado biome, while purchases were partly reduced in the Amazon biome (Moffette, 2018). In the Amazon biome exclusively, Alix-Garcia and Gibbs (2017) showed avoided deforestation due to the CA on the properties that were registered in a Rural Environmental Registry (CAR) and leakage from these properties to those that were not yet registered.
The CAR is fundamental to current enforcement of the SoyM and the CA. Because landowners are required by law to map their properties and because CAR has been made public, the deforestation history of producers are easily calculated by their buyer. Similarly, agricultural producers can obtain a CAR and access to the deforestation history of their parcel in the Amazon with the services of geo-spatial analysts (relatively abundant in the region).8 Therefore, the supply chain policies enhanced by the CAR create a credible threat for the producers and can influence their deforestation behavior. Although the National Institute for Space Research in Brazil (INPE) provides official publicly available deforestation data for the Amazon (PRODES and DETER), no official deforestation data were available for the Cerrado until after 2018. Because of this, producers may be avoiding detection in the Amazon by different strategies, including preferring locations in the Cerrado biome (Richards et al. 2017).
When landowners register their CAR, basic information is provided to define the Legal Reserve of the property (requirement of the Brazilian Forest Code); if the owner has to protect/reforest 80% of their property, the owner knows they are located in the Amazon biome and if the owner has to protect/reforest 20%–35% of the property, the owner knows that they are in the Cerrado biome. Although there may be some uncertainty close to the border (particularly if the property was not yet registered in the CAR), we argue that medium- to large-scale agribusinesses have clear knowledge of the biome where is located their property because with some small investment, the exact areas of their property that fall in each biome can be calculated.
3. Why Proximity to the Amazon Matters
In this section, we present a theoretical framework for agribusinesses in the Amazon biome that face new and stricter environmental regulations. [End Page 159] We explain how this affects agribusinesses production decisions in terms of intensification and location decisions. We generally refer to medium- to large-scale farmers as agribusinesses, rather than smallholders, as they are more sensitive and more aware of environmental policy changes and their implications in terms of future risks. We conclude the section by presenting our testable hypotheses.
Agribusinesses that already own a farm in the Amazon biome maximize their profit from agricultural production. To do this, they decide between two choices: land intensification or extensification. Intensification corresponds to a boosted yield per unit of land for which producers can, for example, increase their inputs or incorporate more productive technologies. Intensification requires the same area but generally results in a greater investment per unit of land and is unlikely to occur when it is cheaper to expand on forested land (Villoria, Byerlee, and Stevenson 2014). Extensification implies that the producer uses additional land to produce greater output while maintaining a similar average production per hectare. Extensification can occur on previously cleared land or may imply clearing additional forested land.9 In our setting, producers face an intensification constraint for their original land in the Amazon, that is, they can intensify but only up to a certain limit given the maximum capacity of their land. However, this constraint can be relieved if they buy more land, which can be located in either the Amazon or the Cerrado biome.
Buying a new property results in two additional costs: the cost of the land and the increased costs in transportation for sharing labor and capital (such as machinery and tractors), which depends on proximity. To understand better how distance matter in our context, we present an overview of the production processes for cattle and soy. First, cattle production often involves two or more farms for breeding and fattening, and ranchers can take advantage of proximity to minimize transportation costs. Furthermore, cattle ranching activities require different sets of inputs and labor, and proximity to another farm helps lower costs. Second, soy production demands a high level of investment in machinery and capital. Sharing trucks and machinery is often optimal. Thus, if a producer in the Amazon decides to expand activities at a new property, a choice in the nearer Amazon biome or in the Cerrado will minimize transportation costs.
In the face of stricter forest protection, Amazon biome agribusinesses that want to expand can choose to intensify, to buy a new property that respects environmental policies in the Amazon biome, or to expand their activities in a less strict region, the Cerrado biome. These agribusinesses will compare the profits for these possibilities and choose the possibility that provides the greatest profit. If intensification is no longer an option (or if it is not the profit-maximizing option) and agribusinesses decide to buy additional land, they will prefer a nearby farm. Indeed, assuming that (1) areas far from the border are not fundamentally different then areas near the border; and (2) areas on both sides of the border (in Cerrado and in Amazon) share similar land characteristics, proximity is a key consideration.10 Whether or not they already own a property in the Cerrado, extensifying activities in this less constrained biome may be the profit-maximizing option for properties with similar prices. Indeed, in the Amazon biome, once environmental policies are more stringent (as under the SoyM and the CA), deforestation for extensification becomes a riskier activity, which increases its implicit cost. In the Cerrado biome, on the contrary, deforestation-related extensification remains at relatively low risk.
Data support our statements that numerous agricultural producers simultaneously own properties in the Amazon and Cerrado biomes, and the average size of each of these properties is bigger than the average property in Mato Grosso. A database that links multiple property maps (CAR, INCRA, and Terra [End Page 160] Legal) and owner information shows that they were 43% of the 128,459 mapped properties for which at least one of the owners owned another property. Restricting the analysis to those properties owned by agribusinesses that have properties in both biomes, statistics reveal that it corresponds to 4,436 properties in the Cerrado biome and 5,792 in the Amazon biome, which covers a total of 6,241,901 and 8,931,926 ha, respectively. Although this is equivalent to 10% of all unique properties in the Cerrado biome (7% in the Amazon biome), it represents 17% of all area covered by properties in the Cerrado biome (17% in the Amazon biome). Supporting the reference to medium- to large-scale farmers of our theoretical framework, the total area of land owned by those who do not have properties across biomes is 1,989 ha, and the total area of land owned by those who have properties across biomes is 10,560 ha, meaning that they own on average 5.3 times more land. Furthermore, soy production on properties owned by those who own properties across biomes represented 25% of all soy production in the Cerrado biome in 2016. These summary statistics align with our theoretical framework. However, it is worth noting that it is a common practice for medium to large owners to put some of their properties under the name of their spouse or children because this provides several benefits, notably in terms of environmental policy and fiscal avoidance. This means the summary statistics presented here are the lower bounds of multiple-property ownership.
According to specialists of the region, it is realistic that employees of the firms or equipment travel distances like 100 km in a single day.11 The state of the roads in Mato Grosso is different than other states of the Amazon, such as Pará, where transportation is more difficult. In general, models that simulate transportation estimate an average speed of 50–60 km/hr in the region, which means that 100 km could take approximately two hours. Cattle can be in a truck for a maximum of eight hours (Santos and Costa 2018), and so traveling 100 km would not affect cattle health. Finally, based on a population of over 25,000 mapped properties that supplied JBS, at any time between 2008 and 2015, the mean distance traveled by suppliers to sell their cattle for slaughtering is 100 km (with a standard deviation of 80 km) (Moffette 2018).
Our theoretical framework allows us to extract three main testable hypotheses. First, if the policies generated spillover effects, agricultural displacement should be greater near the border of the Amazon biome and lower in areas more remote from the border.12 Second, deforestation leakage should be greater near the border of the Amazon biome if land “newly” used for agriculture was deforested just before its use; but if the land was already deforested (e.g., in pasture), then the agricultural spillovers would not necessarily lead to deforestation leakage. Third, agricultural spill-overs should be characterized by extensive production, rather than intensive production.
4. Data Sources and Transformations
The unit of analysis for soy production and deforestation is a 5 × 5 km grid (and as a robustness check, a 10 × 10 km grid). For cattle production, the municipality is the unit of analysis because spatially explicit, multitemporal data were not available. We require units of analysis to have at least 95% of their area in the Cerrado biome. The distance to the Amazon–Cerrado border is defined as the shortest distance between the spatial unit and the closest point of the border. Figure 1 shows the grid cells in the Cerrado biome region according to the distance to the Amazon biome frontier.
Covering the 2001–2013 period, our main dependent variables are soy area (ha), head of cattle, and deforestation (ha). Kastens et al. (2017) provide a spatial panel of data from Mato Grosso where they characterize the [End Page 161]
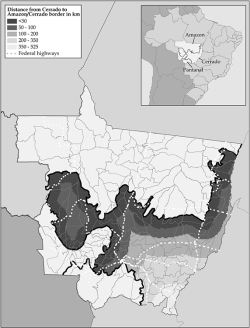
Distance from Each Grid Cell in the Cerrado Biome to the Amazon Biome in Mato Grosso
dynamics of agricultural production. The authors developed a random forest classification model based on a ground reference dataset and on the Moderate Resolution Imaging Spectroradiometer (MODIS) Normalized Difference Vegetation Index (NDVI).13 The ground reference dataset, unprecedented in its spatial and temporal coverage, was used for training the model and included crop type (among others, single and double soy cropping) and noncrop data (such as pasture). The authors combined their data with the Canasat sugarcane dataset from INPE and urban and water information from the IBGE. We create a “soy from pasture” layer based on soy planted in areas [End Page 162] defined as pasture the year before, which reduces the number of observations by one year and corresponds to the 2002–2013 period.14 Head of cattle come from IBGE. To consider potential leakage effects on deforestation, we use forest cover and deforestation data from Hansen et al. (2013). Spatial resolution is of one arc-second per pixel, which corresponds to approximately 0.076 ha in our study region. A canopy cover of 30% is chosen for the pixel to be considered as forested.15 Only pixels considered to be forested in 2000 can be deforested in subsequent years. Reforestation is excluded from the analysis. We transform our dependent variables with the inverse hyperbolic sine (IHS) (Burbidge, Magee, and Robb 1988), which is identified at 0 and reduces the influence of extreme observations.16 For falsification tests, we use the sugarcane information from Kastens et al. (2017) and chicken production from IBGE.
Control variables come from several sources. Soares-Filho et al. (2014) identify soy soil suitability based on slope, soils, and climate for all regions, except for protected areas. As a control, we use the percentage of the grid cell that is suitable for soy. Based on intermediate inputs and rainfed water assumptions, the average potential grass yield (t/ha) is calculated from data of the Food and Agriculture Organization’s Global Agro-Ecological Zones, a data source commonly used in econometrics studies (e.g., Nunn and Qian 2011; Bustos, Caprettini, and Ponticelli 2016). To compare rainfalls, we use data from the Tropical Rainfall Measuring Mission, a joint work between NASA and the Japan Aerospace Exploration. The MMA provides borders of the protected areas (2003–2013). Two categories exist for the protected areas: strict protection and sustainable use. For each unit of analysis, we extract the total area covered by the strict protection and the sustainable use. We also extract the minimum distance to those protected areas and the minimum distance to the blacklisted municipalities. IBAMA provides online map of the embargoes. Population density comes from IBGE. We calculate the distance to the nearest silo in 2006 using a map provided by Conap (a consulting agro-business firm) and the distance to the nearest slaughterhouse in 2008 using a map provided by Vale et al. (2019) (authors of a unique spatial panel indicating the location of slaughterhouses in Brazil). Road density (m/ha) is calculated based on a road map from Imazon, and the distance to the nearest federal highway and the federal highway density (m/ha) are calculated based on a map from the Brazilian Ministry of Transportation.
5. Empirics
We study the effects of antideforestation policies on agricultural activities in less protected regions and examine whether this has caused deforestation leakage. First, we present the empirical strategy for estimating the soy, cattle, and deforestation spillovers in the Cerrado biome of Mato Grosso, using the change in policy context in the Amazon biome. Then we report summary statistics to compare the treatment and the control regions and plot normalized measures of suitability according to distance to the Amazon–Cerrado border.
Empirical Strategy
We identify the effects of the SoyM and the CA on soy, cattle, and deforestation spillovers in the Cerrado with a difference-in-differences framework where the treatment is proxied linearly by distance to the spatial boundary of the Cerrado biome.17 As presented in Section 3, [End Page 163] we assume that if there are spillovers, areas closer to the border should see a greater increase in agricultural production than areas farther from the border; furthermore, if there are agricultural spillovers and if those spill-overs are extensive (rather than intensive), we could potentially identify deforestation leakage. The identification of our main results relies on the common trend assumption between the closest region and the farthest region. However, this may not be the case if, for example, areas in the far Cerrado are growing faster in terms of agricultural expansion; we test for those common trends, the results of which are presented in Figure 2. We make the assumption of linearity in the treatment, which is supported by testing the robustness of our results with a binary version of proximity defined with respect to various thresholds (Table 4) and with nonlinear functional forms (Appendix Table E1). To complement these analyses, falsification tests are presented (Section 6 and Appendix Table G1).
Our empirical strategy consists in estimating the following equation:
where the dependent variables are (1) the soy ha (IHS) per 1,000 ha, (2) the head of cattle per 1,000 ha and (3) ha deforested (IHS) per 1,000 ha of forest cover from 2000. When the outcome is soy, PostPolicyt is equal to 1 after 2006, and 0 otherwise to correspond to the post-SoyM. When the outcome is the head of cattle, the PostPolicyt is equal to 1 after 2009, and 0 otherwise to correspond to the post-CA.18 When the outcome is deforestation, we include both the post-SoyM and post-CA definitions of PostPolicyt. The objective is to identify if there is leakage in deforestation and if so, whether it came from the SoyM or the CA.
The interaction term PostPolicyt × Proximityi identifies the treatment effect. The variable Proximityi is a continuous treatment that equals 1 when the unit of observation is closest to the biome border and 0 when the observation is farther away. The transformation is as follows:
where Disti denotes the distance to the Amazon frontier of the unit of analysis i and Max-Dist is the farthest distance from the Amazon frontier in the Cerrado biome of all units of analysis. Distributed on the interval [0,1], Proximityi is a mirror of Disti and is created to facilitate interpretation. We also estimate models where we discretize distance in a binary variable where Close is equal to 1 and Far to 0. For the sake of completeness, we include robustness checks with other distance specifications (Appendix Table B1).
Controls Xi include different soil suitability variables (soy suitability, pasture suitability, average slope) interacted with the time dummies (Tt). These interactions allow us to estimate the flexible time trends ϕxt′ between the different level of soil suitability and deforestation risk. Specifically, in the regression on soy, we control soy suitability; in the regression on cattle, we control for pasture suitability; in the regression on deforestation, we control for all soil suitability covariates (slope, soy, and pasture suitability). Regressions on soy and deforestation include grid cell fixed effects and the regression on cattle heads uses municipality fixed effects (δi), which control [End Page 164]

Closeness to Amazon Effect: (a) 5 × 5 km, (b) 10 × 10 km
[End Page 165]
for time-invariant characteristics that could correlate with outcomes and proximity to the Amazon. We also include time fixed effects (γt) to sweep out shocks to agricultural and deforestation practices that would affect the whole Cerrado in a similar way. Residuals (ϵit) are clustered at the municipality level, allowing for arbitrary serial and spatial correlation of shocks within municipalities.19 Regressions based on municipality are weighted by their areas because they vary significantly. This is not necessary for the grid cells since 99% of our sample is composed of grid cells of 2,500 ha.
We argue that our research design provides the advantage of not dealing with endogenous policies. Indeed, the supply chain policies in Brazil have been pushed to protect forests by international organizations and were not anticipated. To the concern that monitoring only properties located in the Amazon biome could be endogenous, we reply that the nonenforcement of the SoyM and the CA in the Cerrado biome has been a consequence of data limitations, and even if policy agencies would have wanted to monitor suppliers located in the Cerrado, they would not have been able to credibly do so during our study period.
We acknowledge that other environmental policies affected deforestation rates in the Amazon biome and therefore may have affected soy and cattle production in the Cerrado biome. For instance, a main increase in the stringency of the environmental policy occurred in the Legal Amazon with the Action Plan for the Prevention and Control of Deforestation (PPCDAm). The PPCDAm had two major phases (see Assunção, Gandour, and Rocha [2015] for a full description). The first phase started in 2004 and aimed to increase monitoring, environmental control, and territorial management. Starting in 2008, the second phase created a program to focus on specific municipalities with the highest deforestation (Assunção, Gandour, and Rocha 2015). This program blacklisted municipalities and increased the targeting and enforcement of Brazilian environmental policy in these municipalities (Assunção et al. 2019; Moffette, Skidmore, and Gibbs 2021). Both the PPC-DAm and the blacklisted municipalities decreased deforestation (Assunção, Gandour, and Rocha 2015; Cisneros, Zhou, and Börner 2015; Assunção et al. 2019). The blacklisted municipalities have not been shown to generate negative leakage, defined as an increase in deforestation, in nearby municipalities (Cisneros, Zhou, and Börner 2015; Assunção et al. 2019). However, Assunção et al. (2019) identify positive leakage, defined as a decrease in deforestation, for those higher-risk municipalities that were not blacklisted. This tends to indicate that farmers were expecting the government to increase monitoring in non-targeted locations (Assunção et al. 2019). Furthermore, municipalities in the Cerrado biome of Mato Grosso could also be blacklisted because they are part of the Legal Amazon, which undermines the possibility of leakage from the blacklisted municipalities in this region.
Another major environmental policy is the establishment of protected areas. Literature specific to Brazil is divided about the effects of these protected areas on deforestation. Some authors find no effect (see Anderson et al. 2016; Benyishay et al. 2017), partly because conservation zones are usually located where agricultural production is less profitable (Anderson et al. 2016). Other authors find that protected areas reduced deforestation (see Pfaff et al. 2015) and led to local deforestation leakage (Amin et al. 2019).
First, we note that none of these other policies are specific to our two commodities, as are the SoyM and CA, and to the best of our knowledge, none occurred specifically in 2006 or 2009. This is an advantage for our empirical strategy and to study commodity-specific pretrends. To further test whether one of these policies could have affected our outcomes, we examine robustness checks with controls for blacklisted municipalities and protected areas (Appendix B).
Descriptive Statistics
Table 1 presents outcomes and covariates means, standard deviations, and normalized differences.20 We divide the sample between [End Page 166]

Summary Statistics (Means, Standard Deviations, and Normalized Differences)
Close and Far, using the 100 km threshold. For soy, we observe significantly less area suitable in the near region, while the average rain during the soy season is very similar and relatively similar for the rest of the year. In terms of potential grass yield, the Far Cerrado is more productive and supports larger cattle herds. Slope is on average greater in the Far region. As such, we use soy suitability, potential grass yield and slope as controls in regressions of Section 6. Protected and sustainable areas are different; this is why we present a robustness test where we include those as controls. We note more forest cover in 2000 in the Close region. This supports our choice to normalize the deforestation variable by the forest cover and add a robustness test with a flexible trend of the baseline forest cover as a control. Water surfaces and urban areas are comparable. [End Page 167] We show the average number of environmental embargoes (a policy from the Brazilian government to control deforestation), and remark no significant differences. In terms of minimum distance to nearest federal highway and to nearest silo in 2005 (before the SoyM), it is on average higher in the Close region. Supporting that the Far Cerrado is a reasonable counterfactual for the Close Cerrado, the distance to the nearest slaughterhouse in 2008 (before the CA), the road density, and the federal highway density are similar between the groups.
We plotted the normalized measures of suitability relative to distance to the Amazon biome in Appendix A, using the distances from 125 km in the Amazon biome to 300 km or more within the Cerrado. Areas suitable for soy and potential grass yield are relatively more favorable in regions farther from the Amazon. Furthermore, areas suitable for soy and potential grass yield are similar for the near Amazon and the full Cerrado; both remain between 0.5 of the mean of the standardized variable (Appendix Figures A1(a) and A1(b)). Slope average increases over distance and remains relatively high after 225 km (Appendix Figure A1(c)); although slope can be a constraint for agricultural purposes, it can also be an advantage. Indeed, soy production can benefit from plains with higher elevation because nights are cooler, and this preserves soil humidity. Furthermore, moderate slope does not constrain cattle production, as shown in Table 1, where head of cattle are significantly more numerous in the distant zone of Mato Grosso’s Cerrado. Following these comparisons, we conclude that the far Cerrado appears to be a reasonable counterfactual for the near Cerrado.
6. Results
Effects of the Supply Chain Policies on Soy, Cattle, and Deforestation
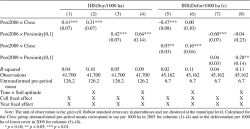
We show the results of equation [1] in Table 2. Coefficients on the interaction between Post-Policy and Close (defined as less than 100 km from the Amazon border) are in columns (1), (2), (5), (6), (9), and (10); coefficients on the interaction of PostPolicy and Proximity (the continuous treatment) are in columns (3), (4), (7), (8), (11), and (12). Odd columns give estimates of the effect with unit of analysis fixed effects and year effects, and even columns add controls. To facilitate reference, we provide the untransformed preperiod mean of the units of analysis within 100 km of the frontier in the seventh row (for soy/1,000 ha, for cattle/1,000 ha and for deforestation/1,000 ha of forest cover). The number of observations is lower for the regressions on deforestation because 142 grid cells do not have forest cover and would not provide variation to the analysis. All specifications are estimated by ordinary least squares, with standard errors clustered by municipality.
Our results suggest that the SoyM generated substantial spillovers into the Cerrado biome. As shown in column (2), grid cells within 100 km of the Amazon border experienced an increase of 31% in soy per ha, compared to the grid cells beyond 100 km.21 Similarly, we find that the CA significantly increased the cattle herd near the Amazon biome. In column (6), the coefficient of interest for the cattle equation is 0.22 (SE 0.07), which corresponds to an increase of 24.6%. Columns (4) and (8) present how the spillover effects decrease as the unit of analysis becomes farther from the Amazon biome.
In columns (9)–(12), we examine whether the agricultural displacements in soy and cattle production have induced leakage in deforestation. The coefficient on Post2006 × Close is negative and not statistically significant (–0.04, SE 0.07). This suggests that spillovers from the SoyM did not increase deforestation near the biome border, compared with areas farther from the border. Consistent results for Post2006 × Proximity[0,1] are shown in column (12) with an estimated effect of –0.18 (SE 0.17). Column (10) shows that the region within 100 km of the biome frontier experienced an estimated increase of 0.12 (SE 0.03) or 12.7% in deforestation because of the CA. The effect calculated on the continuous [End Page 168]

Impact of the Supply-Chain Policies on Agricultural Production and Deforestation near the Amazon Frontier
[End Page 169]
Impact of the Supply-Chain Policies on Agricultural Production and Deforestation near the Amazon Frontier (10 × 10 km Grids)
proximity variable is positive and statistically significant at the 10% level (0.19, SE 0.11).
In sum, the estimated total effects are an additional 848,622 ha of soy,22 an additional 410,201 head of cattle,23 and an estimated leakage effect in deforestation of approximately 10,707 ha in the near Cerrado.24
Table 3 shows the soy and deforestation regressions for the 10 km × 10 km grid cells sample. The results are similar for soy, and slightly larger in magnitude for both column (2) with a point estimate of 0.31 (SE 0.07) and column (4) with a point estimate of 0.64 (SE 0.14). For the effect of the SoyM on deforestation, point estimates are smaller and remain statistically insignificant. However, the effect of the CA on deforestation shows a larger point estimate 0.16 (SE 0.04) in column (6) and larger estimate of 0.28 (SE 0.14) in column (8), which is also statistically more significant. Results are robust to the use of two specifications of distance also for the sample composed of 10 km × 10 km grid cells (Appendix Table F3).
Appendix B provides several additional robustness checks. Results are robust to the use of two other specifications of distance (Appendix Table B1) and to the inclusion of the following controls: protected areas (Appendix Table B2), flexible trends of baseline forest cover (Appendix Table B3), linear trend (Appendix Table B5), and population density (Appendix Table B6). Furthermore, our results remain strongly statistically significant and similar in magnitude when we integrate controls for other policies (Appendix Table B4). We use the distance to the nearest blacklisted municipality in the specifications where we estimate the PostPolicy × Close, as shown in columns (1), (3), and (5), and a control that represents the PPCDAm phase 2 (post-2008) in the specifications where we estimate the PostPolicy × Proximity[0,1], which corresponds to the time period where the blacklisted municipalities started, as shown in columns (2), (4), and (6). Our results are statistically robust to the calculation of spatial-HAC standard errors (Appendix Table B7).
We generate alternative specifications, for both the 5 × 5 km and the 10 × 10 km samples, that have the advantage of testing for [End Page 170] parallel pretrends between the near Amazon region and the counterfactual. In addition, these specifications show the gradual effect of the supply-chain policies on soy, cattle, and deforestation. In Figure 2, we graph the point estimates and the 95% confidence intervals from the estimation of the interactions of year indicators (instead of PostPolicy) and Proximity (with the control variables presented in equation [1]). In Appendix Tables C1 and C2, we include tables that show the point estimates used to create these figures as well as naive estimates without controls.
As illustrated in Figure 2a, soy pretrends for 2001–2005 and cattle pretrends for 2001– 2008 are not significantly different from 0, which supports the robustness of the results in Table 2. The gradually increasing yearly effect of the SoyM on intensification of agribusinesses is not surprising; companies react but because investments in land and equipment are required, changes do not occur quickly. Results are robust to the 10 × 10 km grid cells (Figure 2b). Although the yearly effects of proximity to the Amazon on deforestation present statistical differences for 2004 and 2005, the statistically insignificant differences in pretrends for the deforestation data in the 10 × 10 km grid cells suggests that the parallel trends assumption is plausible, where both the near and the far Cerrado would have follow similar trends in the absence of the SoyM and the CA. Mitigating some concerns, the similar pretrends for soy and cattle between the near and the far Cerrado suggest that statistical differences in deforestation pretrends for 2004 and 2005 are not explained by changes in the two main agricultural commodities and main drivers of deforestation in the region. In addition, our results are unlikely to be explained by a deforestation frontier moving from the far to the near Cerrado, because if they were, pretrends should have been lower before the supply chain policies, whereas in our results, they are marginally higher. The other environmental policies occurring in the Amazon may have affected the increase in soy and cattle production, but the statistically insignificant differences in pretrends suggest that it is unlikely that these other policies affected the agricultural displacements before the supply chain policies.
Finally, we analyze whether one of the municipalities in the Cerrado could be driving our results. We present histograms of our coefficients of interest, where each coefficient is obtained by reestimating
Sensitivity Analysis
We test sensitivity to the cutoff for Close to estimate where the spillovers were the most concentrated. Results from the previous section suggest that the leakage could be due to the CA, since the statistically significant effect on deforestation only occurs after 2009. If cattle spillovers had caused the leakage in deforestation, agricultural displacement of cattle and deforestation leakage should correlate geographically. Results are shown in Table 4 and are divided into three panels (soy, cattle, and deforestation).25 We first analyze the effects from the SoyM on soy and deforestation and follow with the effects from the CA on cattle and deforestation.
The dynamics in soy spillover presents a pattern where the highest point estimate is for the grid cells within 100 km of the biome frontier (0.27, SE 0.05) decreasing slowly farther from the border until a point estimate of 0.25 (SE 0.06) within 250 km of the border. The lower point estimate is for the region within 50 km of the biome frontier (0.15, SE 0.06), likely indicating that agribusinesses have some doubt about the real position on the biome border. Because of this, they may have restricted their expansion in this region. Consistently, deforestation after the SoyM and before the CA is shown to decrease within 50 km of the Amazon biome, while presenting no statistical effect on the regions farther from the border for the same period.
Differently, in the regression on cattle, the region composed of the municipalities within 50 km of the Amazon biome frontier has the [End Page 171]
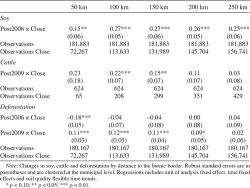
Varying the Close Indicator
highest point estimate (0.23, SE 0.18), but due to the lower number of observations, the estimate is not statistically significant. Varying the Close indicator provides a constant decreasing point estimate. The specific location of the biome border can also matter for cattle producers; however, the municipal-level data are less sensitive than the grid cell data most likely because their greater areas make subtle nuances harder to detect statistically.
Our results could suggest that agricultural displacements have created land market competition in the Cerrado biome between cattle and soy. Indeed, less deforestation between 2007 and 2009 near the Amazon biome region could imply that the increase in soy production did not cause leakage by itself. The increase in deforestation within 200 km of the Amazon border, with significant increase within 150 km after the CA, suggests that cattle ranchers caused the leakage.26
To further investigate the mechanism and causes of the deforestation leakage, we test how intensification versus extensification of soy production changed in the Cerrado following the policies. Using the same empirical strategy presented in
Columns (1), (2), and (3) of Table 5 show that the increase in single soy cropping (in contrast to double cropping) occurred from 2006 and continued after 2009 at an increased rate. In terms of double cropping, estimated coefficients on the post-SoyM and distance treatment show statistically insignificant point estimates at the 10% level, as shown in columns (4), (5), and (6), which suggests that soy [End Page 172]

Impact of the Supply-Chain Policies on Soy Intensification and Extensification
producers did not intensify their agriculture in the near Cerrado. Results in columns (7), (8), and (9) present how soy expanded more on pastureland relative to our counterfactual. This phenomenon occurred from 2007 and accentuated after the CA, when cattle ranchers were also expanding in the Cerrado.27
Expansion of soy in pasture lands is likely to have created land market adjustment between soy agribusinesses and ranchers, where the latter had to search for cheaper land after soy agribusinesses increased their purchase of land in pasture. Scarcity of land that has already been deforested can have pushed agricultural actors to increase deforestation.
Falsification Tests
To examine whether our results are driven by municipal investment in agricultural infrastructure near the Amazon, we estimate equation [1] with two other outcomes that should not be affected by the SoyM and the CA. If confounding factors such as agricultural dynamism in the near Amazon occur after the policies, then our estimates could be false positives. For this purpose, we chose a crop commodity that would compare with soy and an animal commodity that would compare with cattle. Criteria were that (1) the commodity was produced in both Mato Grosso’s Amazon and Cerrado biomes; (2) data for the animal commodity needed to be at the municipal level and data for the crop commodity needed to be spatially explicit; and (3) the production was not marginal. By the process of elimination, we chose the chicken population and sugarcane production.
We acknowledge that required infrastructures and agricultural techniques are different for chicken and beef, such as for soy and sug-arcane. Those differences do no impede testing whether our results could be explained by confounding factors related with agricultural dynamism. Estimations are performed with [End Page 173] five specifications of the Close indicators and with the Proximity treatment. Results shown in Appendix Table G1 present all statistically insignificant coefficients and support the specific effects of the SoyM and the CA on their respective agricultural production.
7. Conclusion
The world’s growing population demands a steady increase in meat and agricultural products. This exerts considerable pressures on land and forests. In the context of climate change, shifts toward stricter environmental policies occur in carbon-dense ecoregions and, as a consequence, can generate leakage in less carbon-dense ecoregions. We study the agricultural displacements and leakage in deforestation generated by two supply chain policies in the Amazon: the SoyM and the CA in the state of Mato Grosso, a predominant agricultural actor in Brazil and the world. Significant results emerge from our analysis. We estimate that in the nearby Cerrado, the SoyM led to an additional 31% increase in soy production (848,622 ha), and the CA led to an additional 24.6% increase in cattle production (410,301 head of cattle). The estimated impact of the CA on leakage in deforestation is an approximately 12.7% increase (10,707 ha). This result could be caused by land market adjustment where the increased use of pasture to grow soy led to competition between soy producers and cattle ranchers. The hypothesized price increase in pasture would have led ranchers to search for cheaper land (i.e., forested land).
Although there are various ways spillovers might occur, the spillovers we identify here resulted from agricultural displacements and modifications to location decisions for those who, in the absence of the two policies, would have continued or further expanded their agricultural activities in the Amazon biome. Because some agricultural displacements could also occur in our counterfactual, our estimated effects are lower bounds.
While the Amazon rainforest provides more carbon sequestration than the natural vegetation in the Cerrado does, it is worth noting the importance of ecosystem services offered by the Cerrado; continued deforestation in this biome would threaten species and water supplies for the tens of millions of residents in the region (Aguiar et al. 2016; Spera et al. 2016; Coe et al. 2017; Strassburg et al. 2017; Vieira et al. 2018 [as cited in Rausch et al. 2019]). Although avoiding deforestation in the Amazon and increasing deforestation in the Cerrado could have a positive impact in terms of carbon sequestration, policy makers should keep in mind that incentives are important and it is not just the “how much” but also the “how” that matters. Indeed, our results support that increase in soy production in the near Cerrado has mainly been soy single cropping, which suggests that no incentives are provided to intensify in this biome.
A limitation of this study is that data on deforestation exclude part of the variation stemming from savanna clearing. Savanna clearing is less easily detectable by satellite imagery. Moreover, cattle may have expanded into savanna, since it can directly serve for cattle grazing, thus involving no detectable deforestation. This is an additional reason we are identifying the lower bound in natural vegetation leakage. That is, we identify leakage in deforestation but disregard land use changes that occur in savanna or natural grasslands and land degradation that occurs from expansion of cattle grazing into savanna.
Further research could focus on land price adjustments and study the land market more directly in relation to the agricultural changes occurring in the Amazon and the Cerrado biomes. Studying land markets would enrich the discussion and our understanding of soy and cattle dynamics as well as deforestation trends.
Supplementary Material
Acknowledgments
The authors are especially grateful to Jennifer Alix-Garcia for her feedback throughout the project. We thank Petterson Molina Vale, Daniel Phaneuf, Lisa Rausch, Laura Schechter, Eduardo Souza-Rodrigues, Christopher Taber, three anonymous referees, and seminar participants at the AERE@ASSA, at the Canadian Resource and Environmental Economics and at the Canadian Economics Association conferences for their helpful feedback and suggestions. We are indebted to Jacob Munger for the construction of the panel database and to Ian Schelley for map creation. Funding was provided by the Gordon and Betty Moore Foundation and Norwegian Agency for Development Cooperation’s Department for Civil Society. under the Norwegian Forest and Climate Initiative.
References
Footnotes
* Appendix materials are freely available at http://le.uwpress.org and via the links in the electronic version of this article.
1. A biome is a set of vegetation and wildlife, constituted by grouping vegetation types that are similar and that can be identified at the regional level with comparable geological and climate conditions and that historically have met the same process of landscape formation, resulting in a particular diversity of flora and fauna (IBGE 2004). The Brazilian Institute for Geography and Statistics (IBGE) and the Ministry of the Environment (MMA) used this “biome” definition to determine the biome borders in 2003 (IBGE 2003) and official biome border remained the same for our study period.
2. Typically, the Amazon biome is composed of humid tropical rainforests, the Cerrado is a tropical savanna, and the Pantanal is covered by wetlands.
3. In a general equilibrium reality, all such decisions are also influenced by prices, land availability/quality, and other factors such as labor and infrastructure.
4. In the Amazon, Andrade de Sá, Palmer, and Di Falco (2013) studied the indirect effects of sugarcane production in the state of São Paulo on forest conversion. Their results suggest that between 1970 and 2006, expansion of sugarcane in the south of Brazil positively correlates with deforestation in the Amazon. With a dynamic general equilibrium model and data from 2005, Ferreira Filho and Horridge (2014) found that each additional hectare in sugarcane would require only 0.14 ha of new land and 0.47 ha converted land from pasture. Regarding soy, results from Arima et al. (2011) suggest that a 10% reduction of this crop in old pasture areas would have decreased deforestation by as much as 40% in the more forested municipalities of the Brazilian Amazon.
5. We briefly discuss the other environmental policies in the Brazilian Amazon in the empirical strategy section.
6. The Brazilian Environmental Agency uses embargoes to apply the Brazilian Forest Code and fine illegal deforestation.
7. Since the large majority of cattle ranchers does not comply with the Forest Code (Gibbs et al. 2019), most ongoing deforestation violates both the TACs and the G4. Although the TACs should also cover the Cerrado biome within the Legal Amazon, this is not implemented because there is no governmental deforestation data for this region.
8. Indeed, even if previous owners deforested after the threshold date, noncompliance would be attributed to the current owner.
9. Assunção et al. (2017) showed that increases in agricultural productivity led to both extensification and intensification and reduced deforestation in the average Brazilian municipality.
10. We compare measures of suitability according to distance to the Amazon-Cerrado border, as well as characteristics of the near and the far Cerrado in Section 5.
11. We specifically refer to a distance of 100 km because it represents our main definition of our binary treatment variable (see Section 5 for more details).
12. An implicit condition for the empirical strategy is that the rate of expansion of soy and cattle decreased in the Amazon biome. We take a four-year window before and after the SoyM and the CA and show that the growth rate of soy expansion decreased by 78% and the growth rate of cattle expansion decreased by 24% in the Amazon biome.
13. NDVI is defined as the visible and near-infrared bands of the electromagnetic spectrum, and with 23 images per year, it allows researchers to study crop seasonality and distinguish crop from noncrop (e.g., pasture). The seasonality of NDVI presents specific patterns that facilitate determination of whether land was crop or noncrop, and if the former, whether single- or double-cropping techniques were used and what type of crop was planted.
14. The transitions from pasture to savanna and from savanna to forest in the Cerrado can be viewed as presenting gradual differences, and as such, the distinctions between the categories are not clear-cut based on satelite imagery. To distinguish between the categories to the best of our ability and given the limitations of the data, we exclude from the “soy from pasture” layer all areas that were identified as forested by Hansen et al. (2013).
15. Results are robust to the use of a canopy cover of 50% (available from authors).
16. The IHS transformation is equal to IHS(X) = ln(X + (X2 + 1)1/2). It can generally be interpreted in the same way as a standard log dependent variable, since its value is approximately equal to log(2X).
17. One key assumption for unbiasedness of the difference-in-differences estimator is that the mean differences in unobserved characteristics of the biomes are uncorrelated with differences in policies across the biomes. Because the policy in the Amazon generates spillovers in the Cerrado, this assumption would not hold in the case of treating the units in the Cerrado as treatments and the units in the Amazon as controls; this would lead to a biased estimator. Our methodology is inspired by Dube, Dube, and García-Ponce (2013), who measured spillover effects in the bordering country where the change in policy did not occur. Specifically, in their context, the gun laws changed in the United States and the cross-border spillover effects are studied exclusively in Mexico, where the control and the treatment groups are defined. Similarly, in our study the policy changes are in the Amazon biome and the cross-biome spillover effects are examined in the Cerrado biome.
18. In Alix-Garcia and Gibbs (2017), the empirical strategy carefully exploits the gradual rollout and acquisition of slaughterhouses related to the CA to identify avoided deforestation in the Amazon biome. In comparison, our context is specific to the Cerrado biome and could not use this methodology without introducing bias. Indeed, the supply zones generated by these authors to create the treatment are based on a wide radius (235 km) surrounding each slaughterhouse. This implies that a single supply zone covers 19% of Mato Grosso’s area (which corresponds to 36% of the Amazon biome of this state). Because there are approximately 30 supply zones, the large amount of supply zone overlap provides meaningful variation to identify the effect of the policy on deforestation in the Amazon biome, but would greatly lack precision for estimating spillover effects in the Cerrado biome.
19. When a grid cell falls in more than one municipality, it is attached to the municipality where its greatest area falls.
20. Normalized difference (Imbens and Wooldridge 2009) is a scale-free measure of the difference in distributions between samples and has two main advantages. First, in comparison to a standard t-test, the normalized difference is not sensible to the sample size, while the t-tests increase in significance when the sample size is bigger. Second, the result of the normalized difference is directly interpretable in terms of how much average standard deviation is the mean from one sample to the mean of the other sample.
21. To obtain the specific effect in terms of percentage, we calculate the marginal effects for the untransformed variables as exp(β) – 1.
22. Premean = 125.3 ha soy/1,000 ha * 21,850,000 ha in the near Cerrado * 31% = 848,622 ha.
23. Premean = 181 head of cattle/1,000 ha * 9,212,000 ha in municipalities of the near Cerrado * 24.6% = 410,301.
24. Premean = 7.4 deforestation/1,000 ha of forest cover * 11,348,000 ha of forest cover * 12.7% = 10,707 ha.
25. Appendix Figure E1 presents a robustness check where we plotted the different coefficient on distance bands that are all included in the same regression.
26. These results are robust with the sample of the 10 × 10 km grid cells (Appendix Table F1).
27. These results are robust and statistically more precise with the sample of 10 × 10 km grid cells (Appendix Table F2).
